|
Collecting data and observing chemical processes and reactions are important
elements in chemistry. However, if you notice in your chemistry text, laws are
usually represented, mathematically, not by data. To compare data to known
laws, it is important to represent the data mathematically. For example, when
dealing with kinetics we are often concerned with the concentration of a
substance. Measuring the concentration at several different times can yield a
set of data which we need to represent with an equation rather than as
separate points. To do this we use a process called line or data fitting, and
in this reading we will explain one of these methods, a process called linear
least squares fitting. This process gives a linear fit in the slope-intercept
form (y=mx+b).
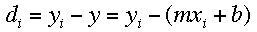
For a general linear equation, y=mx+b, it is assumed that the errors in the
y-values are substantially greater than the errors in the x-values. The
vertical deviation can be calculated using this formula:
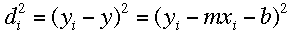
If the square of the deviations is minimized, the "best line" can be calculated:
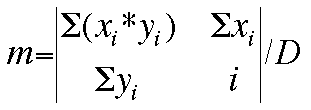
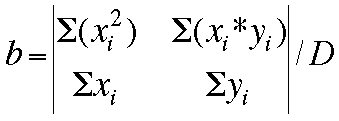
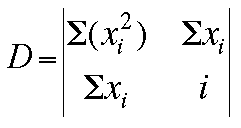
By the use of matrix algebra (determinants), the values of the slope (m) and
the y-intercept (b) can be calculated.
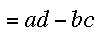
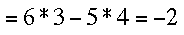
A short review of determinants:
Now, the values for m, b, and the deviation D can be determined by these
matrices:
Notice that this theory assumes the data are in a linear form. If data for a
curve is passed to this program, it still calculates a straight line. Deciding
which type of regression fits best is the user's responsibility. If data is a
curve, there are ways to modify the data in order to fit a linear line. Often
times, taking the natural logarithm or square root of the data will
suffice.
Students: Back
Teachers: Back
|