|
Home
Geometry Optimization Lab Activity
Geometry Optimization Main Page
Students
Introduction
Objectives
Background Reading
Procedure
Questions
Further Work
References/Support Materials
Teachers
Additional Background
Materials
Standards
First year chemistry curriculum concepts
Second year chemistry curriculum concepts
Cartesian Converter Materials
Z-matrix to Cartesian Converter
Cartesian Converter Example
Help Instructions for the Z-matrix to Cartesian Converter
Readings
Overview
Atomic Orbitals
Lab Activities
Z-matrices
Basis Sets
Geometry Optimizations
Ionization Energies
Support Materials
Interactive Tools
Glossary of Terms
Quick Guide to DISCO Output File
Developers' Tools
What's New?
Discussion Board
Team Members
Email the Group
Related Links
ChemViz
Computational Chemistry
SUCCEED's Computational Chemistry
Contact Webmaster
|
In this lab we will be optimizing the geometry of a water molecule. In order
to do this, you will need:
- Waltz Interface on ChemViz
- Spreadsheet
- Z-Matrix Converter
Procedure
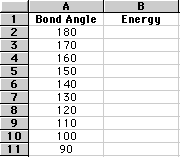
- On your spreadsheet, create two columns, one titled "Bond Angle" and the
other "Energy." In your "Bond Angle" column, list the angles beginning with
180 degrees and decreasing in increments of 10 until you get to 90
degrees.

- Next, determine an initial geometry for a water molecule. Do this by first
placing the Oxygen atom at (0,0,0) and then determining the initial bond
lengths.
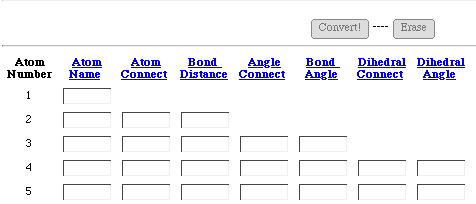
- Put this initial geometry into the Z-Matrix converter and determine the
Cartesian Coordinates for your molecule.

- Now, use the Waltz Interface in ChemViz to calculate the energy of this
molecule.
- Repeat steps 2-4 for different angles ranging from 90-180 degrees in
increments of 10 degrees.
- Save your results in the spreadsheet you already created.
- Once you have collected all your data, graph your results as a connected
scatter plot. Put the 'Angle' values on the x-axis and 'Energy' values on the
y-axis.
- Using your graph, estimate the minimum of your line plot. Narrow your
range (angle values) and repeat steps 1-7 with angles decreasing in increments
of 1 in order to find the most accurate angle that optimizes the water
molecule geometry.
|

