System Model
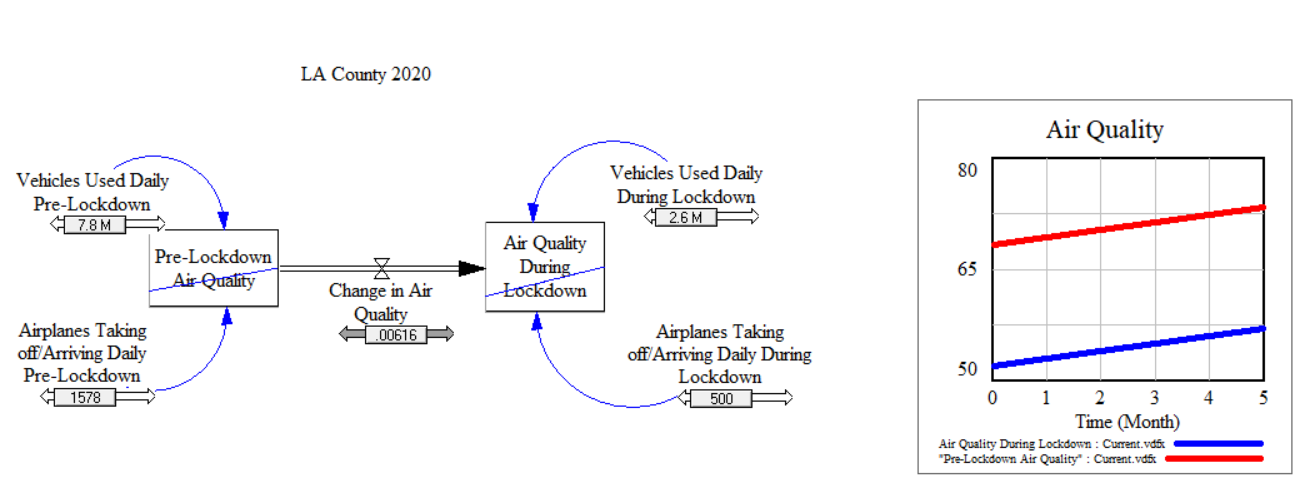
This model uses user input that allows the user to determine the amount of cars used daily during and pre lockdown, as well as the airplanes taking off/arriving daily pre and during lockdown. The graph then displays the average monthly air quality index values, with the red line showing the Pre-Lockdown Air Quality and the blue line showing the Air Quality During Lockdown.
 Click to download System Model
*Note: in order to view the model, VensimPLE must be downloaded