System Model
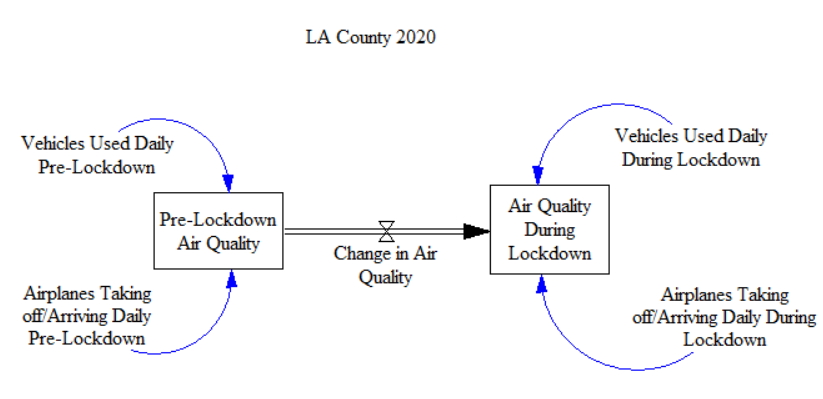
This model uses trends that I determined using data from the EPA. It takes into account the vehicles and planes used daily to determine the change in air quality Pre-Lockdown and the air quality during Lockdown (specific to Los Angeles County). The model displays a graph that contrasts the air quality Pre-Lockdown and during Lockdown.

Agent Model
This model shows the effect of the amount of cars driven on the air quality in LA County (focusing specifically on comparing results prior to and during the COVID-19 pandemic). The cars moving around are represented by particles and the background changes colors in accordance with the AQI values.
