Durham Population VensimPLE Model
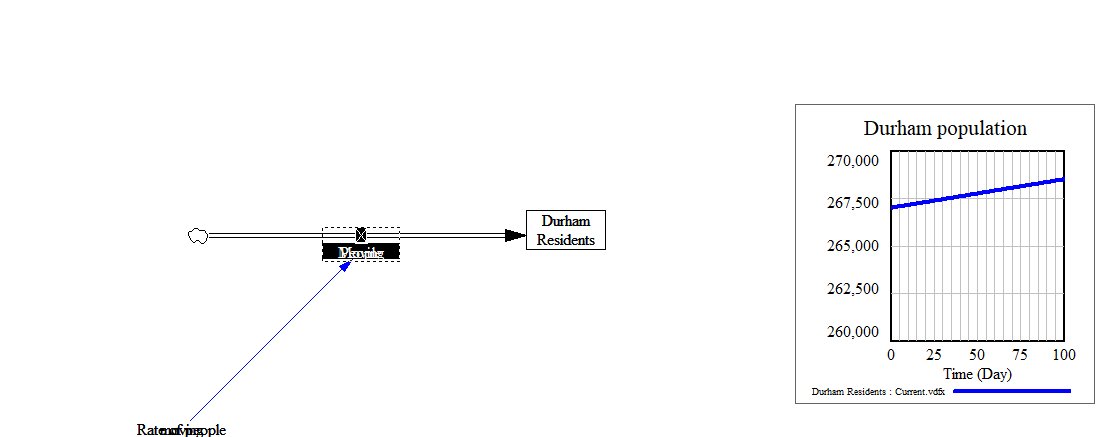
Please click on "Durham Population VensimPLE Model" in order to download and view the model. This model displays a scenario in which the rate of people moving and people moving over time affects the Durham Population by days, which can be increased or decreased with the scroll bar displaying an increase or a decrease of people moving.
Please click on "Ethics Scenario" in order to view the response I gave to the ethics scenario. In this assignment there was an ongoing issue in the office relating to many personal affairs such as a partner going through a divorce and an employee threatening to quit if she was given too much work for her to handle in which it was my duty to respond to the situation since an upcoming deadline was coming up for an important project which involved a grant my boss needed and was counting on us to finish the project.
Dominant/Recessive + Cats/Dogs Model
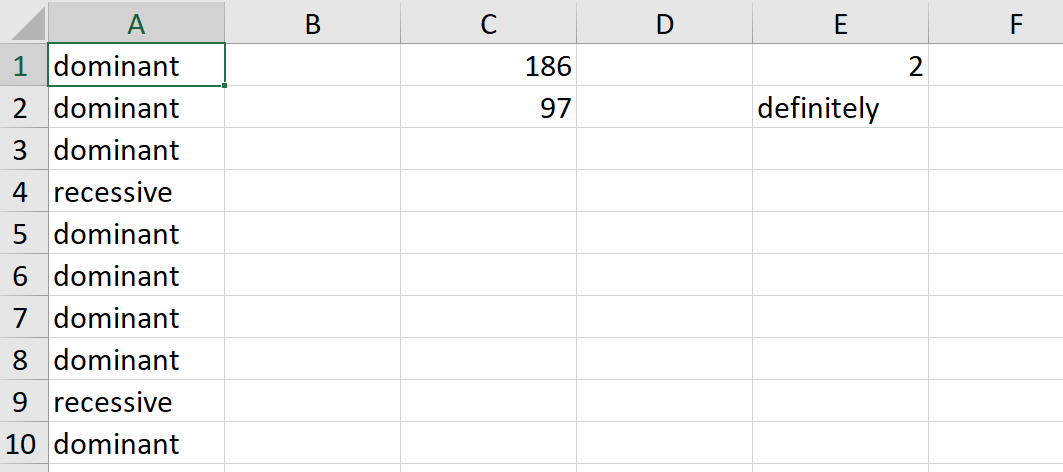
Please click on "Dominant/Recessive + Cats/Dogs Model" in order to download and view the model in Excel.This model illustrates a coin toss, in which heads is dominant and tails is recessive with a random generator to make the toss statistically accurate and can alter how many rows or trials the coin toss will go through before saying how many times the coin landed on heads and how many times the coin landed on tails. The cats and dog's portion of the model allow the user to switch how many cats and dogs there are which will alter the total number of pets in the third column.
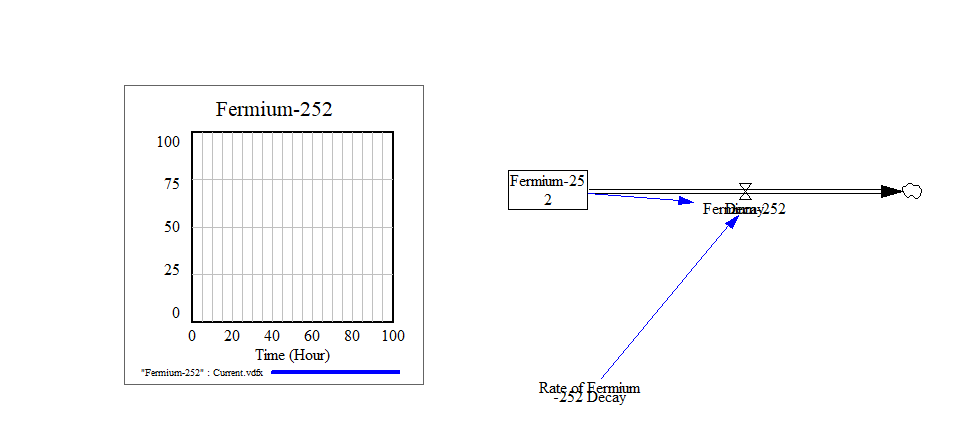
Please click on "Fermium-252 Model" in order to download and view the model. This model illustrates the decay of Fermium-252 which can be altered over time and is represented visually by the graph created after the rate of fermium-252 decay is altered.
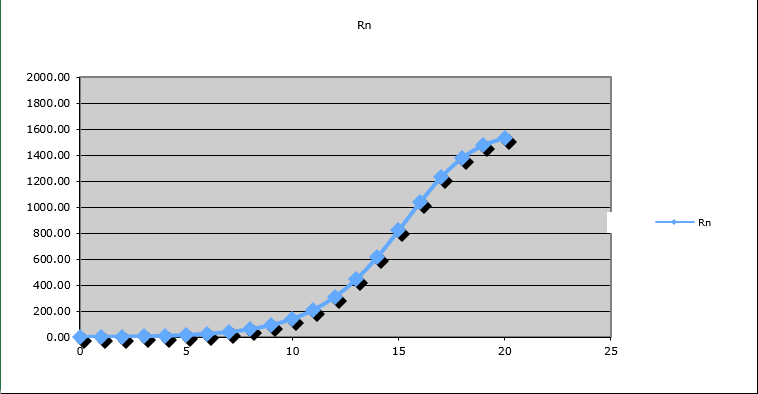
Please click on the "Rabbits Capacity Model" in order to download and view the model. This model illustrates population and theories of Evolution by Charles Darwin with the subjects being rabbits. The rabbit population depends on factors including the rate rabbits are giving birth, competition, and death. The graph that is created based on the adjustments the user can make will show the rabbit population over time with the three factors as well as factoring into the carrying capacity, or how many rabbits can actually be on the canvas without overpopulation.
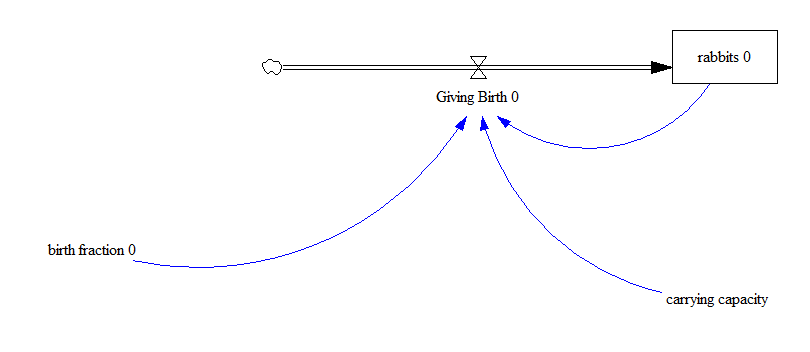
Rabbits Birth Rate and Competition Model
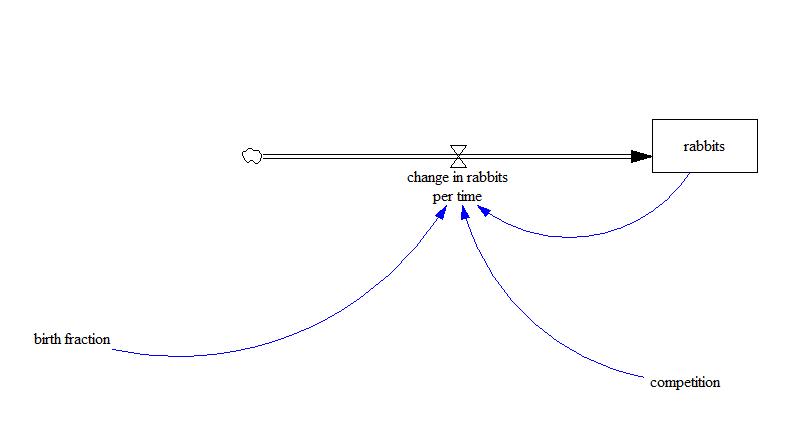
Please click on the "Rabbits Birth Rate and Competition Model" in order to download and view the model. This model illustrates the three factors that go into the increase or decrease of a rabbits population, which is birth fraction, competition, and the change in rabbits per time without factoring into the carrying capacity and the fact of rabbits not giving birth as the last model above illustrated.
Please click on the "Simple Population Model" in order to download and view the model. This model represents population growth where the change in population growth per time is proportional to the population with the implementation of formulas representing HAVE = HAD + CHANGE.
Temperature Diffusion/Square Root Model
Please click on the "Temperature Diffusion/Square Root Model" in order to download and view the model. This model represents temperature change with examples such as an air conditioner spreading warm or cool air throughout the entire classroom using rates of diffusion and square root in order to model the temperature change accurately and with realistic terms.
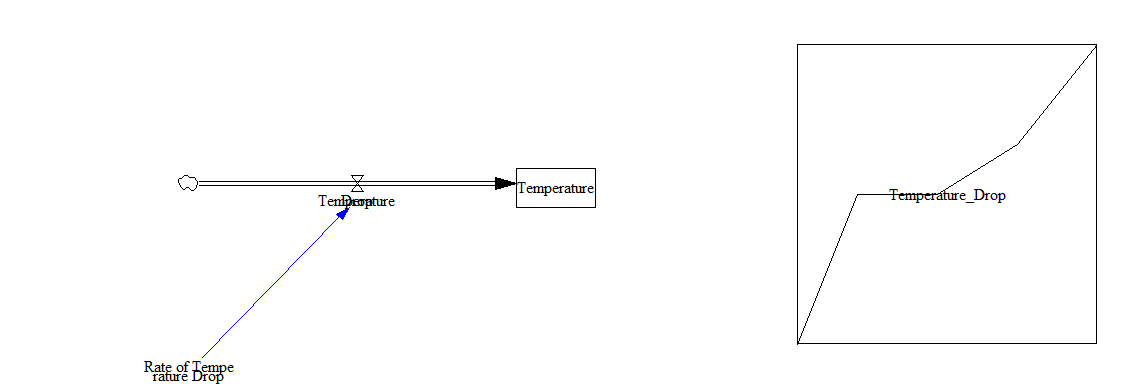
Please click on the "Temperature Drop Model" in order to download and view the model. This model represents the rate of the drop of temperature in an atmosphere which is displayed in a graph that is displayed after it factors into the rate the temperature drops and the amount of time that passes.
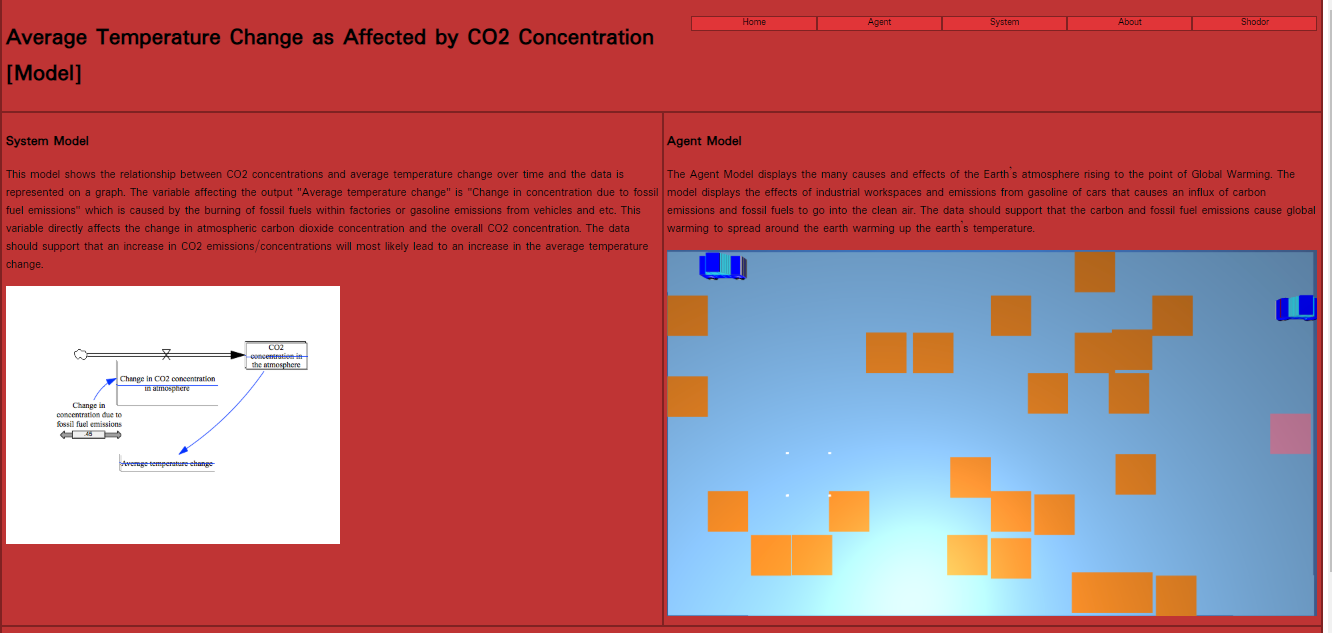
Please click on the "Climate Change Model" in order to be redirected to the website that contains the model. This model was done by me and my partner for the project Doriz in which we decided to model climate change based on Carbon Dioxide Emissions which had factors such as the burning of fossil fuels within factories or gasoline emission from vehicles which altered the amount of CO2 in the atmosphere with an agent model that more visually illustrated the factors.
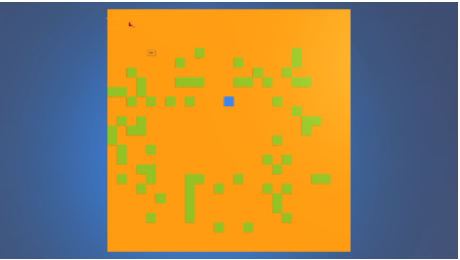
Please click on the "Healthy Sick Agent Model" in order to be redirected to the agent cubes model page which includes my model to be played. This model illustrates a simple simulation of a population becoming sick. When a sick person comes in contact with a healthy person the healthy person has a 50 percent chance of becoming sick as well. This causes a danger to the rest of the population as the spread is contagious and soon the entire population gets sick based off the contact they have with a sick person.
Predator-Prey Model/HTML Tutorial
Please click on the "Predator-Prey Model/HTML Tutorial" in order to be redirected to the web page with the predator prey model. This model was a part of an HTML project assigned to me in which I was brushing up on HTML and CSS with a tutorial on how to do the project which displays a predator prey system model and agent model. This project was intended to help brush up skills previously learned and paved the way for this website to be created.