Agent Model
How to Run
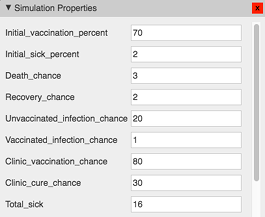
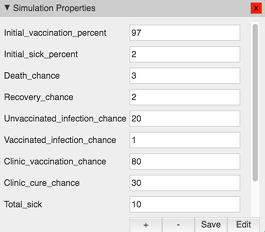
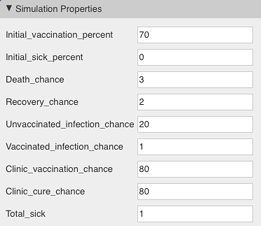
First, click the link above. Then, click "Play" to view the simulation, or "Design" to manipulate the simulation properties and agents. While in design mode, click the green triangle to run and the red square to stop. To speed up or slow down the model, move the slider bar. To move the model forward by a single timestep, press the button directly to the right of the stop button. To change the parameters of the model, click on the gear and then click on "Show Simulation Properties". To place agents, select the pen tool, select the agent you want to place, and then click to place an agent.
Key
- Yellow = Unvaccinated
- Green = Vaccinated
- Red = Sick
- Brown = World
- Blue = Geographical Barrier
- Purple = Counter
- White = Clinic
Screenshots
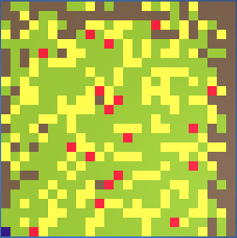
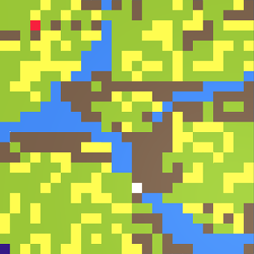
70% Immunity
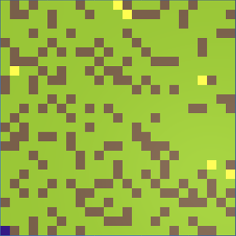
97% Immunity
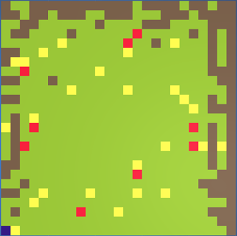
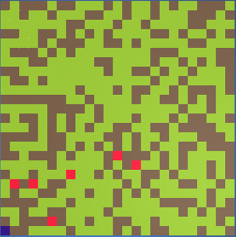
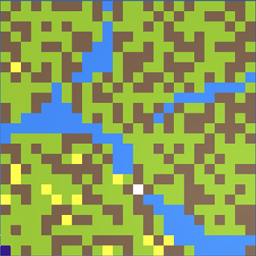
Geographical Barriers and Clinic
Observations
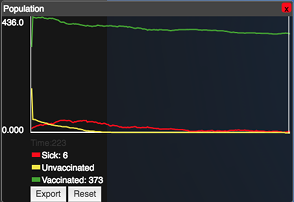
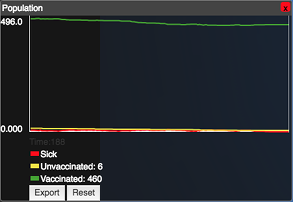
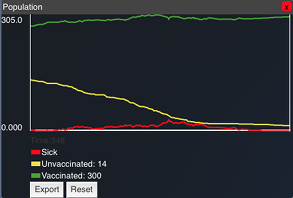
In the 70% immunity simulation, the disease spread quickly among the unvaccinated people because the herd immunity was compromised. Most of the disease was eventually eliminated because the majority of the population was still immunized, but the entire vulnerable population was killed off before the disease was eliminated. In the 95% immunity simulation, the disease did not spread easily because there were very few vulnerable targets to spread to. The disease was quickly eliminated, with quite a few of the vulnerable still surviving due to herd immunity.
In the simulation that included geographical barriers, I had the world split roughly into four quadrants. The barriers made it difficult for the disease to spread from one section to another. One of the quadrants had a clinic placed at the entrance, which made it nearly impossible for any agents to bring the disease into that section. This is why most of the vulnerable people in that section survived. I also ran a few iterations of a much larger and much smaller world to see what happened if you changed the scale. I noticed that as long as the density of people remains the same, the overall trend doesn't change. However, if the world is less dense the chance of the disease spreading is much less, and if the world is more dense the chance of the disease spreading is much greater. The largest model I tried was 75 by 75 squares, and the overall trend was the same as the normal world. However, it ran a lot slower, so I wouldn't recommended pushing the limits of the model beyond that.