System Model
System Model
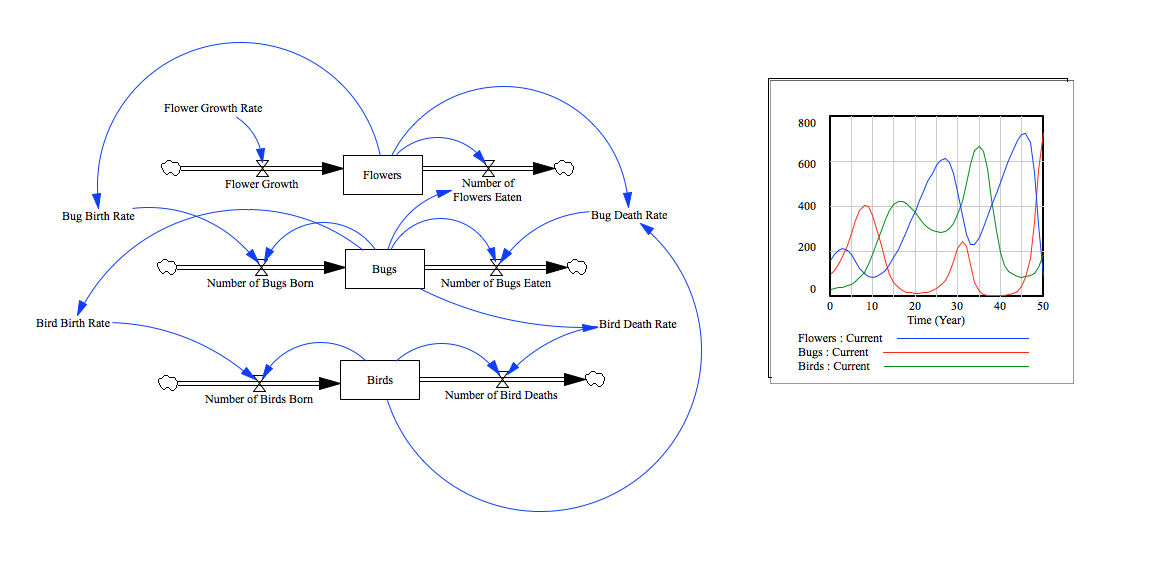
The software VenSim is needed to open the VenSim model. Click the boxed text that says "System Model" above to download an mdl file with the VenSim model. Once the file is downloaded, open the file with VenSim. To run the simulation, click simulate or SyntheSim. If you click SyntheSim, you can adjust the slider bars and view how the graph of the model changes as variables change. The main parameter of our model is flower growth rate. The flower population increases by (flower growth rate) * 625 / 3 every period of time.
Explanation
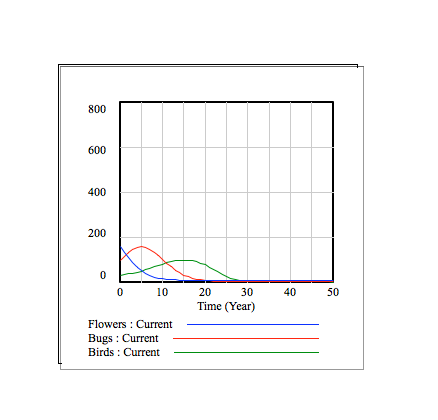
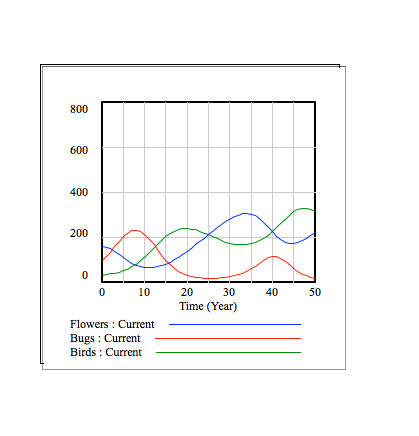
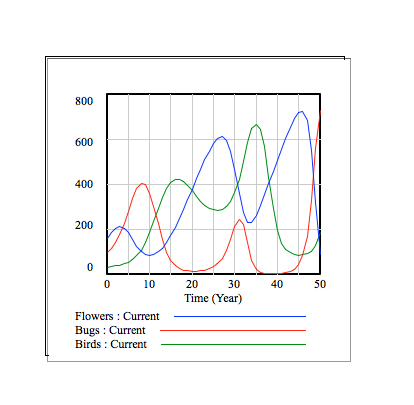
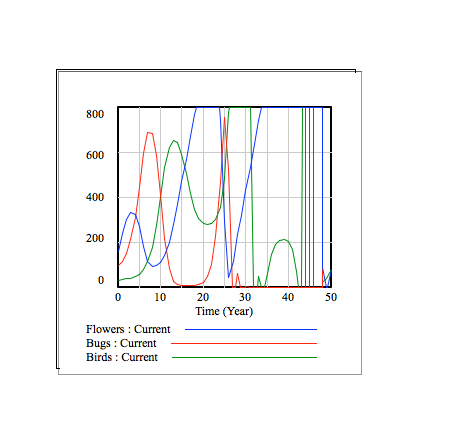
The following graphs show the flower, bug, and bird populations over time. The different graphs display this information for different values of the flower growth rate.
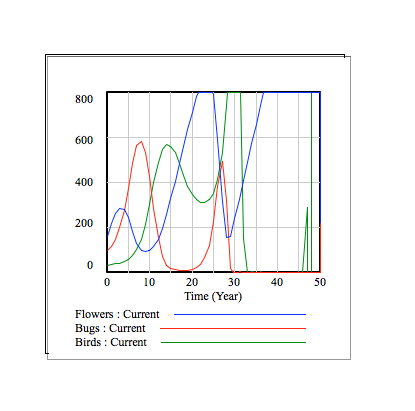
In the context of this model, the flower population increases by (flower growth rate) * 625 / 3 every period of time. From top to bottom, the graphs have flower growth rates of 0, 0.1, 0.25, 0.4, and 0.5.
Overall, it is visible that, for our system model, larger growth rates correspond with greater fluctuations in the 3 populations. For example, when the growth rate is 0, no new flowers grow, and the food supply of the bugs and birds eventually runs out. On the other hand, when the growth rate is 0.5, the bug and bird populations have very large fluctuations, and, when the bird population greatly increases, the bug population greatly decreases.
One can see the relationships between the 3 populations in each of the graphs. In the beginning, the flower population begins to increase first, as there are not as many bugs. As the flower population increases, the bug population also starts to increase, as more bugs are finding food and reproducing. As the bug population increases, the flower population decreases, as more flowers are eaten by bugs. Also, with an increase in bug population, the bird population increases, as more birds are eating and reproducing. The decrease in flower population and increase in bird population then means a decrease in bug population, as seen on the graph. After the bug population decreases, the flower population increases, as there are less bugs. The bird population then decreases, as there are less bugs to eat. The increase in flower population and decrease in bird population then causes another increase in bug population, and the cycle continues.
As each population increases and decreases, the other 2 populations respond accordingly, allowing the system to maintain itself.
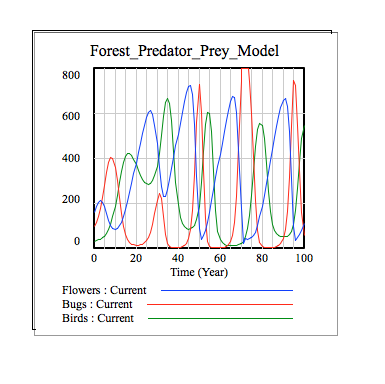
The final graph depicts the 3 populations over a period of 100 years with a flower growth rate of 0.25. Changing the scale, one can see that the population continues to fluctuate as time continues.