Introduction
COVID-19 has affected everyone in all parts of the world in 2020. As of June 23, 2020, 9.1 million people worldwide have or have had this virus, and 472,000 people have died. In the United States alone, 2.36 million people have contracted the virus, and 122,000 people have died. The virus has harshly affected many of the large cities in the United States, primarily New York City. In the city alone, around 213,000 people have been infected and 17,509 people have died. This project is meant to show how this virus has spread in the city, and perhaps what could have been done to prevent the spread of the virus, which has taken a massive toll on the economy of the country. I have made to different models to show different angles of the situation, and to provide different answers to 2020's biggest problem, Coronavirus.
System Model
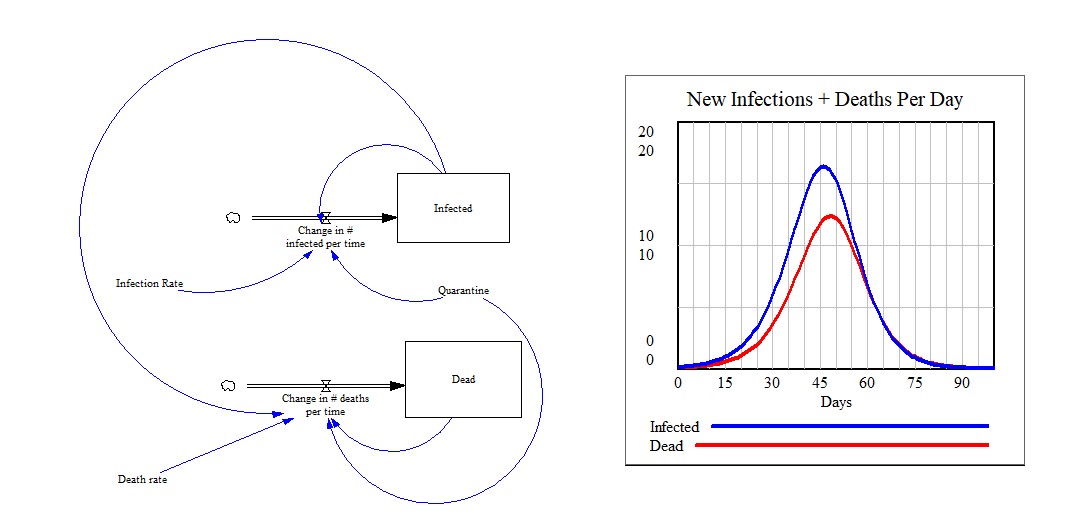
This is a system model with two diagrams and a rate going towards a level in each one. One diagram has the level “Infected” while the second has the level “Dead.” The rate pointing to the Infected level is called “change in # infected per time” while the rate pointing to the Dead level is called “change in # deaths per time.” The first diagram is affected by the variables, “Infection rate” and “Quarantine” while the second diagram is affected by the variables “Death rate” and “Quarantine.” Arrows point from Infection rate and Quarantine to Change in # infected per time. Also, arrows point from Death rate and Quarantine to Change in # deaths per time. The variable “Infection rate” has the equation 0.21 to model the actual 21% infection rate in New York City. The variable “Death rate” is given the equation 0.097 to model the 9.7% death rate in NYC. These numbers are variable once the model is simulated, and you can change the variable values for different outcomes in the graph. The Dead level has an arrow pointing to Change in # deaths per time to show how quarantine can lessen the number of deaths from the virus, which has been integrated to the rate. There is an interactive graph that changes as each of the variables are changed in the model, with lines for Infected and Dead.
Agent Model
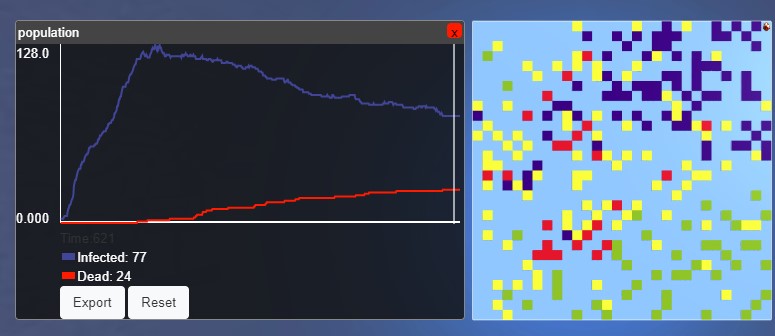
This is an agent model with a 30 by 30 world called NYC. There are 2 agents, “Person” and “World.” The agent, “world” is the platform of the main world for other agents and shapes to move and complete actions on. This agent has no tasks. There are many randomly scattered “person” agents in the world. The agent has 3 methods total, setup, while-running, and run. Run is the main method where all the rules are found. One rule is how these agents all move randomly around the world. There is 1 infected agent that moves randomly in the world, but slowly. If a healthy agent is next to an infected agent there is a 21 percent change that the healthy agent changes into an infected one, spreading the virus. If a healthy agent remains in the world after 60 timesteps, there is a 75% chance they will remain static and not move to simulate quarantine. If an infected agent remains in the world after 15 timesteps, there is a 95% chance they will remain static in the world. After 72 steps and onwards, there is a 10% for the infected agent to become an Immune agent and recover, and a 2% chance that the infected will become a Dead agent and die. Immune agents move freely on the world, but 50% slower, without the risk of getting reinfected. There is a counter that counts the number of infected and dead agents, and graphs them on a pop-up graph.