
Course Chapters
Section Tests
Online Calculators Linear Least Squares Regression Newton's Method Equation Solver
Related Information Links
|
Data Fitting: Linear Least SquaresFor a general linear equation, y=mx+b, it is assumed that the errors in the y-values are substantially greater than the errors in the x-values. The vertical deviation can be calculated using this formula: 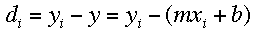
If the square of the deviations is minimized, the "best line" can be calculated: 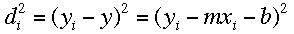
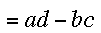
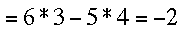
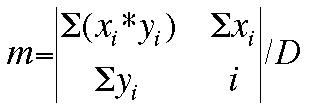
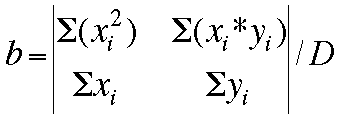
By the use of matrix algebra (determinants), the values of the slope (m) and the y-intercept (b) can be calculated. A short review of determinants:
Now, the values for m, b, and the deviation D can be determined by these matrices: 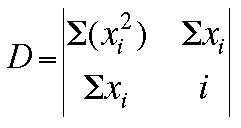
The regression form which is available submits the entered data to a perl script, which calculates the above matrices and graphs the data with the regression line. Notice that this theory assumes the data are in a linear form. If data for a curve is passed to this program, it still calculates a straight line. Deciding which type of regression fits best is the user's responsibility. If data is a curve, there are ways to modify the data in order to fit a linear line. Often times, taking the natural logarithm or square root of the data will suffice.
| ||||||||


 Shodor
in cooperation with the Department of Chemistry,
The University of North Carolina at Chapel Hill
Copyright © 1996-2008 Shodor
Please direct questions and comments about this page to
WebMaster@shodor.org