 StimulatingUnderstanding
of Computational
science through Collaboration,Exploration,
Experiment,
and Discovery
for students with Hearing Impairments StimulatingUnderstanding
of Computational
science through Collaboration,Exploration,
Experiment,
and Discovery
for students with Hearing Impairments |
|
|
|
Notes For Teachers!
Will Global Warming Push Trees to Extinction?
Notes on teaching the lesson: This inquiry-based lesson allows
the students to explore some of the factors that effect changes in a tree
species' range. The students use an Excel spreadsheet to determine the
hardwood tree species that grow in their area. They collect information
on these species from USGS and USDA sites. The students enter the data
they have collected into a computer model. The model comes in two versions,
Stella and Java. The Stella model has better graphics and allows the students
to explore how the model works and potentially improve the model. The Stella
model must be downloaded along with a free Save-disabled version of Stella.
The Java model is available on a web page within this lesson.
Scientists work at the cutting edge of our understanding. Over time, our
concepts become more refined and our ability to measure and predict things
becomes more accurate. The background page introduces the students to the
varying degree of certainty that we have for different aspects of global
warming. As the students evaluate the effect of global warming, they are
asked to express these effects in terms of the inherent uncertainty in
the values. As scientists, it is important that we identify the uncertainty
in our results. This allows others to appreciate the limits of our research
and think of additional research that can further refine our collective
understanding.
This lesson is designed to help the students learn that science
and computer models are valuable tools to solve real life issues. Using
science allows the students to understand what happens and how it happens.
From a societal standpoint, the value of science is in how we use this understanding.
By applying their understanding of global warming, the students can see
how science can be used by communities to protect the environment and to enhance
the beauty and recreational value of our communities.
The following are the student pages. Answers and suggestion for the
teacher are in
BLUE.
Activity
Will global warming push trees to extinction?
This question assumes that a tree's range may shrink with rising global
temperatures. This assumption in turn assumes that a tree's range is, at
least in part, dependent on temperature. The first question to investigate
is; "can you demonstrate a relationship between a tree's temperature tolerance
and its geographic range?"
The United States Geological Survey provides Excel spreadsheets for
hardwood and softwood trees. The data in the spreadsheets shows the percentage
of trees of a species that are found in areas of different temperature
and precipitation.
The table below shows part of that data. The common names of the trees
were added to the USGS spreadsheet. The annual temperature spreadsheet
was sorted to select trees that grow in the southeastern US. The 5 trees
in the table are of the genus Acer. These are the maple trees that are
native to the southeastern US.
| HARDWOODS |
|
|
|
|
|
Annual
Temperature (°C) |
|
| Taxon name |
Common name |
|
N |
0% |
10% |
25% |
50% |
75% |
90% |
100% |
| Acer
barbatum |
Florida maple |
|
636 |
14.0 |
15.0 |
16.0 |
16.9 |
17.9 |
18.9 |
20.2 |
| Acer
leucoderme |
chalk maple |
|
191 |
14.1 |
15.3 |
16.0 |
16.6 |
17.1 |
18.4 |
19.9 |
| Acer negundo |
boxelder |
|
6534 |
-2.3 |
2.5 |
6.0 |
10.1 |
14.7 |
17.9 |
26.1 |
| Acer rubrum |
red maple |
|
4842 |
-1.1 |
3.3 |
5.8 |
11.1 |
16.1 |
18.7 |
23.8 |
| Acer saccharinum |
silver maple |
|
3792 |
1.3 |
5.8 |
7.9 |
11.0 |
14.1 |
16.3 |
20.0 |
The column "Taxon name" is the scientific name for the tree. The column
"N"
is the number of trees that were identified out in the forests and used
in the study. The 0% column is the annual temperature for the coldest tree
that was found. For Florida maple that was 14 degrees Celsius. The 10%
column shows the temperature that 10% of the trees grow at or below. For
example, 10% of the Florida maple trees grow between 14 and 15 degrees
Celsius. In the same way the 50% column shows the temperature that half
of the trees grow at or below. The 100% column shows the warmest temperature
that a tree was found.
From this data you can calculate the temperature range for each species.
Acre barbatum grows in areas with annual temperatures that range from 14
to 20.2 degrees Celsius. This is a 6.2 degree Celsius range. Calculate
the range for each species and arrange the species from smallest to largest
temperature range.
| scientific name |
common name |
low temp |
high temp |
range |
| Acer leucoderme |
chalk maple |
14.1 |
19.9 |
5.8 |
| Acer barbatum |
Florida maple |
14.0 |
20.2 |
6.2 |
| Acer saccharinum |
silver maple |
1.3 |
20.0 |
18.7 |
| Acer rubrum |
red maple |
-1.1 |
23.8 |
24.9 |
| Acer negundo |
boxelder |
-2.3 |
26.1 |
28.4 |
The second part of our question is, "What is the tree's geographic
range?"
Again the United States Geographical Survey provides maps of the areas
where these trees are found.
Florida maple range
chalk maple range
boxelder range
red maple range
silver maple range
You need to determine the north- south range for each species of maple
tree. This should be an uninterrupted line within the trees' range. Use
a sheet of paper to help measure the north- south range. Put the lower left
corner of the paper on the lower left corner of the trees range. Slide
the paper to the right keeping the lower edge of the paper on the lowest
side of the range. As the paper moves the trees range will move up and
down the left vertical edge of the paper. Mark the highest point that the
range reaches on the paper. If the range is in more than one block you
will need to repeat this for each block selecting the largest distance.
Next you need to convert this distance to miles. The map doesn't have
a key but the state boundaries are marked. If you know the north south
dimension of a state you can use that state as a key. You can find the
dimensions for states by going to netstate.com.
Arrange the maple tree species from smallest to
largest north south range.
chalk maple
Florida maple
silver maple
red maple
boxelder
Compare your two lists.
Do the temperature and geographic ranges list
the trees in the same order?
Yes
Explain the relationship between a tree's temperature
tolerance and its geographic range.
The trees with a narrow temperature tolerance
have a small geographic range. The larger the temperature range the larger
the geographic range.
Defend or criticize the statement, "Global warming
will change where we find a tree species."
There appears to be a relationship between the
geographic range of a tree and the temperatures of the area that we find
the tree. If the area in an area changes the trees in that area may be
affected. Some trees may no longer be well suited to live there. Other
trees may be able to move into the area. We see a relationship between
the trees' temperature and geographic range but this may be coincidental.
Defend or criticize the statement, "Some tree
species will be affected more that others by global warming."
Trees that have a large geographic or temperature
range may lose some trees at the southern edge of the range but most of
the trees will still remain in the tree's range. Trees who's seeds are
dispersed over large areas by birds may be able to maintain their range
by moving north as fast as the southern boundary of the range moves north.
Trees with small initial ranges and or small propagation rates will see
their ranges shrink or disappear. The students don't have evidence to support
this yet but it is a reasonable hypothesis.
Model2
There are hundreds of different kinds of trees in North America. You
won't have time to gather information on all of these tree species today.
You need to have a way to narrow your investigation. You can start by finding
the hardwood trees that live in your part of the country.
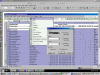
Open the hardwood Excel spreadsheet that comes with this lesson. This
spreadsheet is from the U.S. Geological Survey web site http://pubs.usgs.gov/pp/1999/p1650-a/datatables/index.html
Select the "ANNT" worksheet. This shows the Annual Temperature distribution
for 230 hardwood species. Columns M-R indicate which parts of the U.S.
the trees are found. You can use columns M-R to sort the trees and find
the kinds that live near you. Select cells A4 through S233. From the toolbar
select "Data". From the "Data" menu select "Sort". A window will open that
lets you select the column you want to use to sort the spreadsheet. North
Carolina is in the South Eastern part of the U.S. so I select column "R"
to sort the data.
 Click "OK" and the spreadsheet will be sorted with the trees from your
area at the top.
Click "OK" and the spreadsheet will be sorted with the trees from your
area at the top.
How many different kinds of hardwood trees grow
in your part of the U.S.?
Answers will vary.
Divide the trees that grow in your area between the students in your
class. You will need to gather three pieces of information for each of
your tree species.
1 Find the current north - south range for each
tree species. Use the same procedure you used in this lesson's activity
page. Range maps can be found at the US Geological Survey CLIMATE
- VEGETATION ATLAS.
Answers will vary.
2 Find the number of years it takes a tree to
grow from seed to the point that it will produce its own seeds. This is
the number of years between each step the tree species moves north
Answers will vary..
3 Find the distance from the parent tree that
the seeds will grow. This is the propagation distance. Answers
will vary.
A good place to start your search for the propagation distance and
years to reseed is the US Department of Agriculture site TREES
OF WESTERN NORTH CAROLINA. If your tree isn't listed on this site try
a web search for the information.
Design a table to collect your information. After
you have collected your data use the HABITAT RANGE
MODEL to determine if your trees may become endangered.
Answers will vary.
What is the current range of your trees?
Answers will vary.
What range does the model predict for your trees?
Answers will vary.
How certain are you of this figure? Express your
uncertainty in + miles. Answers will
vary.
Need HELP CALCULATING YOUR UNCERTAINTY?
How much has the tree's range shrunk?
Answers will vary.
Is the tree in danger of becoming extinct?
Answers will vary.
Repeat the simulation for each tree species using
different values for warming expected in the next 100 years.
Answers will vary.
Prepare a report of your finding. Make a recommendation
of actions that should be take to protect trees that may become endangered
or extinct.
Students may recommend that seed banks be created
to preserve seed stock from trees that may become endangered. Students
may recommend that an organized effort be undertaken to distribute seed
from potentially endangered trees be distributed into the woods north of
their current range to help the trees maintain a population within their
preferred climate range. Some students may not see the value in maintaining
rare species. They may feel that any efforts undertaken should voluntary
and not government sanctioned.
Developed by
 The
Shodor Education Foundation, Inc.
The
Shodor Education Foundation, Inc.
Copyright © 1999-2001 by The Shodor Education
Foundation, Inc.
This project is supported, in part,
by the
National Science Foundation
Opinions expressed are those of the authors
and not necessarily those of the National Science Foundation.
|
 |
Last Update: 5-MARCH-2003 13:29:11 EST
Please direct questions and comments about this
page to
krobertson@shodor.org