The goal of this simulation is to simulate the effect of rainfall on different soil types. Runoff is what occurs when rain is not absorbed by the ground on which it falls and so then flows downhill. As it does so, it will carry topsoil, nutrients,
and any other water-soluble material it encounters as it flows downhill. Eventually runoff water will drain into a stream or river. All of the land whose runoff water flows into a particular river or stream is known as that stream's
watershed.
Why is it important to model runoff water?
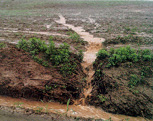
Have you ever been to a construction site? Have you noticed the pathways that water carves through the soil? Those small ditches were caused by runoff water. Runoff water is the main mechanism of erosion in many areas. But this is not the only problem caused by runoff water. The topsoil picked up by the
water as it flows towards a river is deposited into the river.
This can cause serious water quality problems. Water clarity and purity are affected by this extra soil. Another serious problem is that of contaminants carried by the runoff water. As it flows across streets and through fields, runoff water will carry chemicals such as fertilizers and pesticides to wherever it drains. This can lead to an accumulation of these materials in
the water bodies in that watershed. The result of adding pesticides and fertilizers can be disastrous. Most pesticides are toxic to all living creatures, not just bugs, and can have deleterious effects even in small quantities. The addition of
fertilizers (such as Nitrogen) to water will achieve the same effect that it does when it is on the land: it encourages plant growth. So the primary plants of the water system will begin to grow and reproduce more rapidly. These plants are microscopic algae,
and when you see a river that has turned green or has a green "mat" of scum over the surface, that is the result of these microscopic organisms reproducing too rapidly. The decay of the algae will result in reduced oxygen levels in the water, affecting the entire ecosystem of the stream.
By making models, we can see what would occur in a system if we changed certain characteristics of it, without actually making the changes. For example, it we wanted to know what would happen if we put in a parking lot in a place that
is currently a field, we could simulate this in the model without actually putting in the parking lot.
How is surface water runoff determined?
There are a number of ways to determine the amount, or quantity, of water that runs off of a surface. In addition to collections that are done in the field, we can also use computer models and simulations to estimate runoff. One of the methods, the Soil Conservation Service Runoff Curve Number (CN) method, is currently the most appropriate and authentic of the numerical models in use by soil scientists. The underlying mathematics of the SCS CN method are described in the runoff algorithm page. but some of the key concepts of the model are described here.
Over the years, data collected in the field has been analyzed. This data has been produced in a number of forms. One is graphically as an "X-Y" graph, shown below. On the "x" axis is the independent variable, in this case the amount of rainfall in inches. On the "y" axis is the dependent variable, the amount of direct runoff of water in inches.
The graph shows generally that as the rainfall increases, the amount of water that runs off increases. Makes sense, doesn't it? We use the data collected and the mathematics created from this data to build a predictive model. A predictive model is one that allows us to predict how much runoff will occur when the next big rainfall happens, such as if another hurricane makes it into the middle of the state.
You should have noticed that there are a number of different curves on the graph, each one increasing as the rainfall increases. Each of these curves represents what happens at a particular curve number, or CN. The curve number, described in more detail below, comes from a table of data depending on what kind of area (city or farm), what kind of soil we have, and what is covering the soil. The numbers in the legend on the right of the graph represent the curve numbers, beginning at 40 and going to 100.
What does "Q" depend upon? It depends upon three items that we can calculate:
- the amount of rainfall in inches, known as "P"
- the "initial abstraction" value, represented as "Ia" (read this: "eye subscript 'a'"). Ia is the number that represents all of the water that hits the ground that is unavailable for runoff. Some of the water from rainfall is absorbed by plants, some of it sits in puddles or lands right in a lake or pond, some of it evaporates back into the atmosphere, and some of it soaks into the ground. All of this is is the "initial abstraction." The value of "Ia" depends a great deal upon the kind of soil in the area being studied and the kind of plants covering the soil.
- variable is calculated from another value, the "potential maximum retention after runoff begins" number, known as "S." S is also determined based on the type of soil and the amount of kind of plants covering the ground. As you will see in the reading on the algorithm, Ia is 20% of the value of S.
- The value of S depends on yet another number, the "curve number", or CN. The curve number depends on four factors:
- the hydrologic soil group (HSG)
- the type of ground cover (e.g., the kinds of plants covering the soil)
- the treatment (e.g. has the soil been plowed, is it bare soil, etc.
- its hydrologic condition (poor, fair, or good, depending on how easily water runs off the surface)
What is a hydrologic soil group?
Soil groups which are classified according to their drainage potential. Group A soils absorb a lot of water and are deep, well-drained, and composed of sand or gravel. Conversely, Group D soils do not absorb as much water and have a high run-off potential, and have a layer of high clay content near the surface or are shallow soils over bedrock or other material which does not absorb water.
(For more info, visit the
Penn State Earth System Science Center Database page on HSG percent)
What about storms? What is a 100-year flood?
It is a probabilistic assessment that means a given event has a one-in-one hundred chance (1 percent) of occurrence in any given year, or a "return period" of once every 100 years. Such assessments are based upon statistical frequency of collected data, as presented in Table 1. The reader can see from this table that the 100 year return period storm has a 9.6% chance of occurrence in 10 years, 22% chance in 25 years, 39% chance in 50 years and an 86% chance in 100 years.
So why do we hear so much about "100-year floods"?. In hydrology, there are actually three types of comparative assessments: 1) rainfall within a given time interval; 2) peak stream flow; or 3) volume of flow caused by a single storm event or sequence. Each of these attributes can be measured and counted as discrete data points, to provide statistical comparison, or frequency analysis. As a consequence, we can have a 100-year storm, a 100-year peak flow event, or a 100-year flood, all of which may or may not be independent of one another.
Although the media commonly use the terms "100-year storm" and "100-year flood", storm periodicity is always married to some time interval, such as 24 hours, a week, a month or a season.
What are the different types of ground cover?
Obviously the kinds of ground cover greatly influences the amount of water that will run off of a surface. We can say that different types of communities often have different cover types. For example, an urban rea, like a city, might have these cover types:
- open space (lawns, golf courses, cemetaries, parks, covered with grass)
- streets and roads
- paved parking lots, shopping centers
- houses and residential areas
- offices and business areas
There exists a complete set of curve numbers, or CNs, for urban areas. Likewise, there is a chart of data for cultivated agricultural land, or farm land that is being used. Some example cover types are:
- fallow (bare soil or temporarily cover crops like grass)
- row crops (corn, potatoes)
- full grain crops (wheat, barley)
Finally, there are curve numbers for other agricultural lands:
- pasture, grassland, grazing land
- meadows
- brush
- woods/grass combinations
- woods
Hydrologic condition refers to how sparse or dense the ground cover is, and thus how easily water runs off the surface. "Sparse" and "dense" are meaningless or irrelevant for some types, such as pavement, but are significant qualifications on agricultural cover. The hydrologic condition is called "poor" if the ground cover is relatively sparse, "good" if it is relatively dense, and "fair" in between. Lands in poor hydrologic condition are more prone to runoff.
How much is good? It varies, for different types of ground cover. For brush or pasture, over 75% is good and below 50% is poor. For open space in urban areas, above 70% is good. Residential urban areas also have a relevant hydrologic condition based on density of residences; town-houses and quarter-acre lots are considered poor, while large spreads of a few acres are considered good. A full list is in the explanation of terms.
The curve number data is provided to scientists in a table form. An example table, this one for other agricultural lands, is shown in a separate window. In the model itself, you have to "dial in" the cover type, the hydrologic condition, and the soil group (A,B,C,D). Based on your selections, the model looks up the correct curve number, and puts that number into the mathematical model:
So, to summarize the science. The amount of water that runs off and causes all kinds of problems depends heavily on the amount of rainfall and the type of ground it lands on. If we know this information, we can use a predictive model like the Soil Conservation Service Runoff Curve Number method to predict the amount of water that will run off.
|