|
a collaboration of the
Shodor Education Foundation, Inc.
, Eastern North Carolina School for the Deaf,
Barton College
, the
National Technical Institute for the Deaf
, and
Interpreters, Inc.
|
|

|
Home
|
For Interpreters!
|
Search
|

how
 ASL |
How Do I Use This Activity?
This activity allows the user to manipulate a function graphically by using slider bars to change the value of the constants and coefficients in the function. | |||||||||||||||||||||||||||||||||||||||||||||||||||||||||||||||||||||
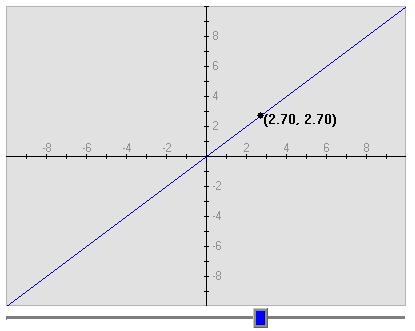
ASL | Controls and OutputThe initial graph at the top of the activity is set to F(X) = x. The coordinates of the black point on the function are printed beside the poinnt. You can move the point left and right on the graph by using the blue slider bar below the graph.
| |||||||||||||||||||||||||||||||||||||||||||||||||||||||||||||||||||||
ASL | Enter the function you want to graph in the box marked f(x)= . Any constant or coefficient you wish to manipulate must be entered as a number. | |||||||||||||||||||||||||||||||||||||||||||||||||||||||||||||||||||||
ASL | For instance, if you wish to experiment with the linear function f(x) = x and wish to manipulate the coefficient of x, it is necessary to type the equation as f(x) = 1*x. The computer recognizes the multiplier 1* as a parameter and makes a slider so you can change it. | |||||||||||||||||||||||||||||||||||||||||||||||||||||||||||||||||||||
ASL | Likewise if you wanted to manipulate the y-intercept in the linear function f(x) = 2*x, it is necessary to typpe f(x) = 2*x + 0. (Try typoing in the function and click the "Set Function" button so you can see the difference.)  | |||||||||||||||||||||||||||||||||||||||||||||||||||||||||||||||||||||
ASL | Use the following notations for the operations:
| |||||||||||||||||||||||||||||||||||||||||||||||||||||||||||||||||||||
ASL | When using exponents and x is less than zero, the exponent must be written as a whole number or in fraction form, not a decimal. For instance, if you want to graph the fifth root of negative numbers, you must type x^(1/5), not x^(0.2). | |||||||||||||||||||||||||||||||||||||||||||||||||||||||||||||||||||||
ASL | Beside the function is a checkbox labeled "Exponents Change". If your function has an exponent that you want to manipulate, check this box. If you want the exponent to remain constant leave the box unchecked. | |||||||||||||||||||||||||||||||||||||||||||||||||||||||||||||||||||||
ASL | After entering the function, click on the Set Function button to the right of the input box. The computer graphs the function. The equation of the function appears below the graph where each constant and coefficient is written in a different color. Slider bars will appear colored the same colors as the respective constants or coefficients that they manipulate. | |||||||||||||||||||||||||||||||||||||||||||||||||||||||||||||||||||||
ASL | The Change Function button takes the user back to the first screen to make a change to the function or type in a new function altogether. | |||||||||||||||||||||||||||||||||||||||||||||||||||||||||||||||||||||
ASL | The Reset Sliders button will place the sliders back in their original, central position after being used. | |||||||||||||||||||||||||||||||||||||||||||||||||||||||||||||||||||||
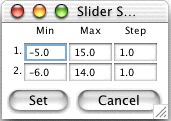
ASL | To change the minimum and maximum of the slider bars, click the Slider Limits... button. This will display a window where you may set the minimum and maximum of each slider bar. You can also set the step size for each slider bar. The step size determines what values the slider bar will stop at. For instance, if you set the minimum to 0, the maximum to 1, and the step to 0.1, the slider will stop at 0, 0.1, 0.2, etc. However, if you set the step to 0.2, the slider will stop at 0, 0.2, 0.4, etc.
 | |||||||||||||||||||||||||||||||||||||||||||||||||||||||||||||||||||||
ASL | To see a grid on the graph, check the Show Grid checkbox. | |||||||||||||||||||||||||||||||||||||||||||||||||||||||||||||||||||||
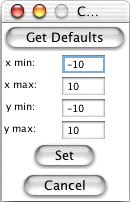
ASL | You may set the graph boundaries by clicking the Set Window... button. This will display a new window where you may enter new values for the x max, x min, y max, and y min. After you have entered your new settings, click the Set button. To return the graph boundaries to their defaults click the Get Defaults button followed by the Set button.
 | |||||||||||||||||||||||||||||||||||||||||||||||||||||||||||||||||||||
ASL | Checking the Show Trace checkbox will leave old functions on the graph as you change the slider bars. For instance, suppose your function is y = 3*x+5. If you check Show Trace and then drag the slider bar for the slope through the values 3, 4, 5, and 6, all four functions (y = 3*x+5, y = 4*x+5, y = 5*x+5, and y = 6*x+5) will be visible at the same time. The Clear Trace button will remove the old graphs. | |||||||||||||||||||||||||||||||||||||||||||||||||||||||||||||||||||||
| ||||||||||||||||||||||||||||||||||||||||||||||||||||||||||||||||||||||


Developed by
The Shodor Education Foundation, Inc.
Copyright © 2002 by The Shodor Education Foundation, Inc
This project is supported, in part, by the National Science Foundation
Opinions expressed are those of the authors and not necessarily
those of the National Science Foundation.