Measure to Measure - Page 5
The Surface Area Function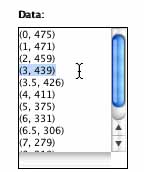
Let's determine how surface area varies with our choice of cut. Open the Data Flyer again, but this time use the cut as the first number of the ordered pair and the surface area as the second. For example the cut of 3 has the surface area of 439 units squared. The ordered pair for these values would be (3, 439). Enter in the rest of the values.

Click "Auto Window" and then "Plot Data." What is the shape of the graph? Surface area is represented by the y-values. Where is the y-value (the surface area value) the highest, or the maximum? Does it make sense?
Cut vs. Surface Area
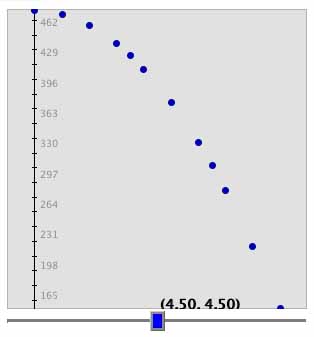
Let's find a good model to fit this graph. Would a line best fit the data? The data seems to curve quite a bit, so a line may not be the best fit.
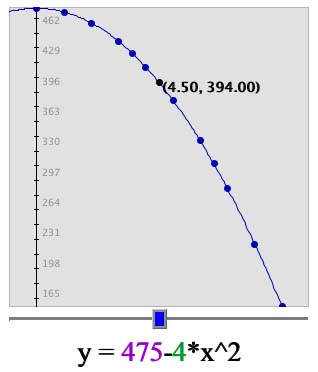
How did we find the values for surface area? If you recall, from page 1 we built the boxes by cutting four square tabs out our original area, which was 19 units x 25 units = 475 square units. We use these details to generate a Surface Area Formula!
Enter in the formula "475-4*x^2" into the text box next to "y=" and click
"Set Function".
 Does this curve fit the data?
| Auto Window | Zoomed Out |
 |
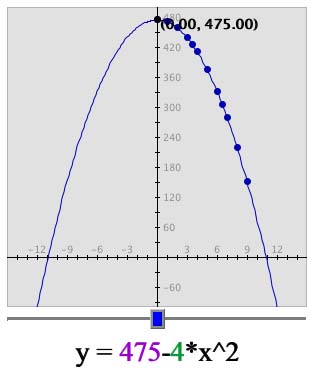 |
Notice how the graph curves and is not in a straight
line. This curve is because in the equation we have x2
and not just x. 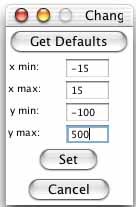 We call this
 curve a parabola. It is easier
to see when you zoom out. To see this on your graph click on "Set
Window." Then change "x min:" to -15, "x max:" to 15, "y min:" to
-100, and "y max:" to 500. Then click "Set."
curve a parabola. It is easier
to see when you zoom out. To see this on your graph click on "Set
Window." Then change "x min:" to -15, "x max:" to 15, "y min:" to
-100, and "y max:" to 500. Then click "Set."
The formula that we use surface area is SA = 475 - 4*cut2 and is a mathematical model of the relationship between the cut and surface area. What happens when x (the cut) in the mathematical model increases? The surface area decreases, which is also true in the real model (bigger cuts remove more material). On the other hand, smaller cuts remove less material and result in higher surface area.
Note however that the function goes into areas of the graph that are negative, whereas in real life there is no such thing as 'negative volume' and we cannot make a 'negative cut'. As a scientist it is again important to realize that even a 'perfect' mathematical model is only valid where it makes physical sense, which may only be some portion of the function.
| On to Page 6! |