Measure to Measure - Page 4
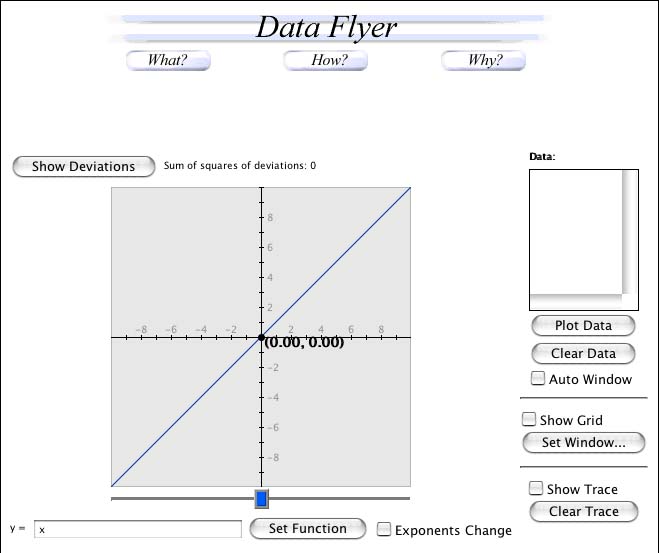
Graphing DataOpen the Data Flyer applet. The Data Flyer will allow us to plot our data points with a function in order to better understand our data.
Let's plot the Mass against the Volume of the boxes of different cuts to better understand the relationship between mass and volume. We are going to
use an ordered pair, or 2 numbers where the order is important. 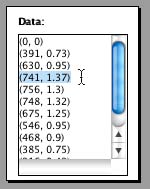 Enter
in volume as the first number and mass as the second number. For
example, the volume value for cut 3 is 741 units3,
and the value for mass may be something like 1.37 kg.
The ordered pair that you enter in the "Data" would be
(741, 1.37). Enter all of your data points like this for each cut.
You can also include the point (0, 0) representing a "box" that has no volume -
which would also hold no mass!
Enter
in volume as the first number and mass as the second number. For
example, the volume value for cut 3 is 741 units3,
and the value for mass may be something like 1.37 kg.
The ordered pair that you enter in the "Data" would be
(741, 1.37). Enter all of your data points like this for each cut.
You can also include the point (0, 0) representing a "box" that has no volume -
which would also hold no mass!
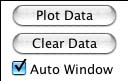
Click "Auto Window" so that the Applet will determine an appropriate range of x (volume) and y (mass) values for the axes, and we will be able to see the pattern of our data. Then, click "Plot Data" to view the graph. What pattern do you see? The points should be organized somewhat like a line slanted upward to the right.
Volume vs. Mass
Now let us plot a line through the data and then find an equation that is the "best-fit." Lines follow the general equation y= mx + b, where m represents the slope, or steepness of the line and b represents the intercept, or place where the line crosses the vertical axis. The intercept is equal to the "y" value (second value in each ordered pair - in this case the mass) when the "x" value (the first value in each ordered pair - in this case the volume) is zero. We know that our intercept is 0, again because boxes with zero volume will hold zero mass.

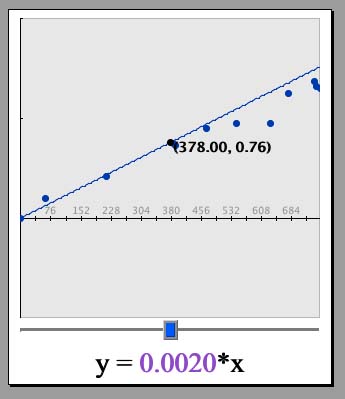
Type in 0.0021*x in the box that says "y=". The number "0.0021" is a guess for the slope of the line, the "*" is the computer representation of a multiplication "times" sign, and "x" is the variable in the general formula. Click "Set Function." A formula should appear below the graph with the slope in purple and a slider bar (also in purple, next to the "Change Function" button). A line should also appear on the graph, going through our data points. Does this line adequately represent the data?

Move the slider bar left and right by clicking and dragging on the purple box with the pointer. What happens to the slope value? What happens to the graph? Note that the larger the slope, the steeper the line on the graph! Now look directly above the graph to where it says, "Sum of squares of deviations." This number is a measurement of how good the line fits the graph. The smaller this number is, the better. Adjust the slider bar until this number is as small as possible. (Note, if the deviation number contains an "e", like "1.547e6", the "e" is a computer representation for "times 10 to the power of", meaning that the number is actually quite large. In this applet, numbers without an "e" exponent will be smaller than ones with one).
Try different numbers until you find one that fits. The line y= 0.0018*x is a good fit for the sample data. If you click on "Change Function," you can manually adjust the number. Can you find a "perfect fit?" Why or why not?
The line should not perfectly fit the data. Experimental measurements of things like mass always have some variation. However, the line will give us a best estimate as to the general relationship between the mass of the sand and the volume of the box.
| Find the Relationship! |
The 0.0018 in our equation represents y/x, or the slope. If we think about what the x and y values represent, we can see that the slope, y/x, is mass / volume. This value represents density. It is the mass per unit volume. What is the density (in kg per cubed unit) of the sand?
Density
Using our sample data, the density of the sand would be the slope in our equation, or 0.0018 kg per units3. In other words, we can hold only 0.0018 kilograms in a single cubic unit. A kilogram is 1000 grams, so we can hold approximately 1.8 grams in a one unit by one unit by one unit cube.
| On to Page 5! |