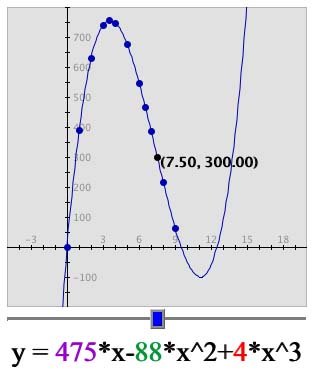
Look at the graph to the right. Note that there are no data points over a portion of the graph. Why not?
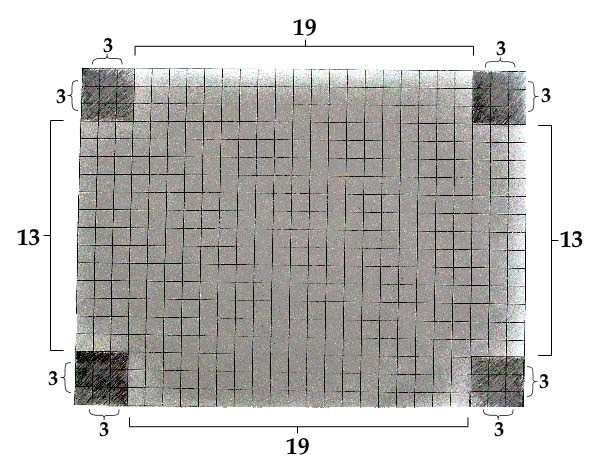
Let's consider our first box from page 1. The piece of paper was 19 units x 25 units. Then we cut out 3x3 squares out of each corner. What was our new length and width? Remember the way we found the formula for volume on the Volume Formula! page? We determined that the length is 19 - 2x, where x is the value of the cut. If x is 3, we get 19 - 2(3) which equals 13 units. The equation that we found for width is 25 - 2x. When x is 3 we get 25 - 2(3), or 19 units. A visual representation of the length and width is shown below.
Length and Width
Let's see what happens if we have a cut of 15. If we cut out 15x15 squares from each corner, the length would be 19 - 2(15), which is -11. How can we have a side of length -11 units? This value is not physically possible. Width and length need to be positive values for this equation to make sense. Therefore we cannot have a cut of 15.
|
Could we have a cut of 10? We need to find the limits for the cut. These limits will become our domain. A length needs to be 0 or above to be possible. So, to the right, we have set our length equation equal to 0 to determine what cut is NOT acceptable. We find that x = 9.5. |
|
Therefore, x cannot be above 9.5. Also, x should not be less than 0 because it doesn't make sense to cut a negative number out of a piece of paper. Therefore our maximum should only lie within the domain, or limit of x-values, and our domain is from 0 to 9.5.