| |
|
AERMOD
AERMOD is a relatively new model, designed to replace the Industrial Source Complex (ISC) model described in a previous unit. AERMOD is a steady-state plume model that can be applied to:
- rural and urban areas
- flat and complex terrain
- surface and elevated releases
- multiple sources, including point, area, and volume sources)
AERMOD generally looks at short modeling periods, such as one hour or less, calculating concentrations of pollutants in the plume following relatively steady meteorological and pollutant release conditions.
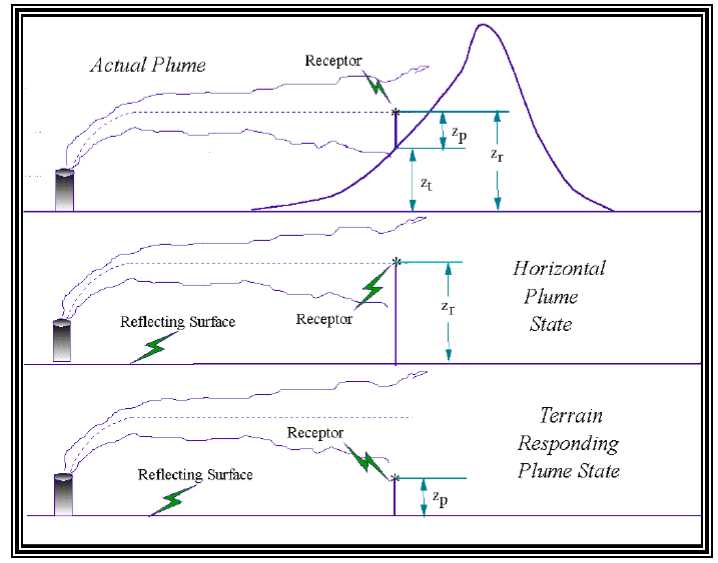
| AERMOD uses a two-layer structure found in through theoretical and experimental work: in a stable atmosphere, the lower layer remains horizontal while the upper layer rises over any existing terrain, divided by the terrain height. In a neutral or unstable atmosphere, the lower layer disappears and the plume rises up and over the terrain.
The graphic at right (click on graphic to see full-sized in a separate window) shows the two layer structure of the modeling system. |
|
The concentration of the pollutants at the receptor is calculated as follows:
Concentration (at the receptor) = aChs + bCtfs
where a and b are weighting factors, Chs is the concentration at the receptor point in the horizontal state, and Ctfs is the concentration at the terrain-following state.
Structurally, AERMOD consists of one main program (AERMOD) and two preprocessors:
- AERMET: the meteorological pre-processor, whose main purpose is to calculate the boundary layer parameters. AERMET also passes all meteorological observations to AERMOD. Input to AERMET comes from National Weather Service (NWS) datasets and/or on-site observations.
Inputs to AERMET include:
- albedo
- surface roughness
- Bowen ratio
- wind speed and direction
- temperature
- cloud cover
The preprocessor then calculates (and passes to AERMOD) these planetary boundary layer (PBL) parameters:
- friction velocity (u)
- Monin-Obukhov length (L)
- convective velocity scale (w*)
- temperature scale
- mixing height (zi)
- surface heat flux (H)
- AERMAP: calculates a terrain height scale (hc) from gridded terrain data. The pre-processor calculates, for each receptor, the representative terrain elevation, or "hill height", associated with that receptor. The terrain elevation at each receptor determines the flow of the plume at that particular receptor.
| The graphic at right (click on graphic to see full-sized in a separate window) shows the basic data flow from the two pre-processors (AERMET and AERMAP). The graphic shows how meteorological and planetary boundary layer (PBL) parameters are passed from the AERMET preprocessor and terrain data (as x-y-z coordinates and as terrain height scale (hc) are passed from the AERMET preprocessor to yield plume concentration data. |

|

|
The graphic at left (click on graphic to see full-sized in a separate window) shows a visualization of the elevations of the hills surrounding a point source. The elevation starts around 350 feet extending to about 600 feet. The radial graph looks at the elevations at 100, 200, 300, 500, and 1000 meters. |
| AERMOD is available for various platforms, including Windows-based PCs and Linux machines. The graphic at right (click on graphic to see full-sized in a separate window) shows a sample output screen (using a commercial viewer running on a Windows machine). A complete input and output run is available in a separate window. The graphic shows the plume as it moves towards the northwest. The color scale on the right shows the concentrations of the pollutants, with red indicating a higher concentration in the plume. |

|
Confused? Have a question? If so, check out the Frequently Asked Questions (FAQ) page or send mail to the OS411 tutor (os411tutor@shodor.org) with your question!
Report technical/content problems here
|
|