|
[ Home | Statistics | Algorithm
| Architecture | Application | Glossary
]
These equations are chosen by the program called DataFit by Oakdale Engineering. It determines the best data-fitting
equations, and there are two best equations in this application. They are linear and non-linear equations.
Linear Least Squares Regression application
and algorithms can be found by clicking on links. This linear equation is shown below:
Y= a * x + b
This non-linear is being used by DataFit 6.1 application to determine the closest data fitting. The non-linear
equation is being used below:
Y = a * b ^ x
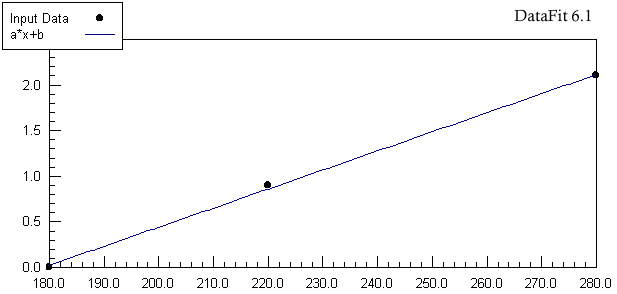
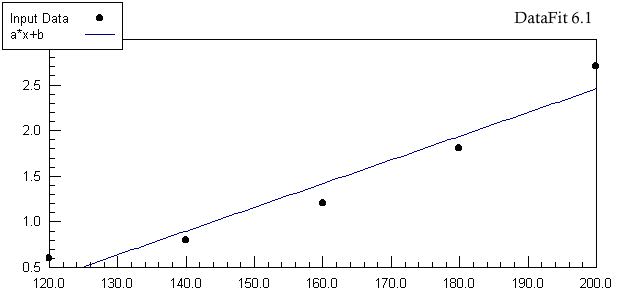
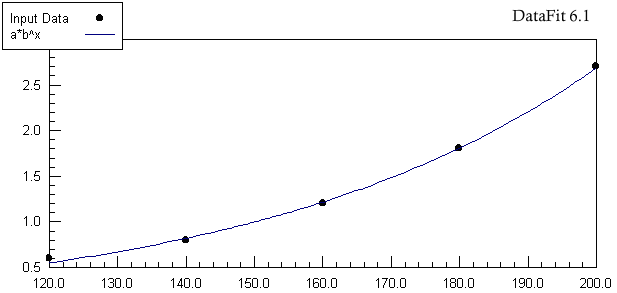
There is a plotting chart to show you what data-fittings look like. The dots should be very close to line where
the equation are at. It should be at 95% accuracy, not any less.
Chart of Linear equation:

Chart of Linear equation (worst case):
The points are clearly way off from the linear, and it is not best recommended equation to use. The next chart
after this is the correct equation, both of charts do have the same data.

Chart of Non-Linear equation (best case):
It is the best possible solution to get the dots closer to the curve line.

How were the risk factors computed: (see chart of your report)
- Record the risk factors in two columns of X and +.
- In the column X, record all the risk factors which are 1.0 or less.
- Record in column X the average 1.0 for all the other risk factors.
- In the column +, record all the risk factors above 1.0 but substract 1.0 from each risk factor before recording
it.
The book explains where the authors got the risk factor numbers for every risk factors. Here is the formula
for risk factor:
| RF = |
p ( 1 / p ) of the event for SPECIFIC members of the race-sex-age group
DIVIDE BY:
p ( 1 / p ) of the event for ALL members of the race-sex-age group |
|
How was Composite Risk Factor computed:
- Multiply the factors in the column X by each other.
- Sum the factors in the column +.
- Add the product (in step 1) to the sum (in step 2) to compose of Composite risk factor.
How was Present Risk Factor computed:
- Look up the Average Risk for heart attack for specified age, gender and race.
- Multiply the Average Risk by Composite Risk Factor and it becomes Present Risk Factor.
How was Health Appraisal Age computed:
- By using Present Risk Factor and using last digit of age, look up in HAA tables for specific race and gender.
- Locate PRF in row and last digit of age in column, whatever intersects is the health appraisal age.
How was Body Mass Index (BMI) calculated:
- Multiply patient's weight in pounds by 0.45
- Multiply patient's height in inches by 0.025
- Square the answer from step 2
- Divide the answer from step 1 by the answer from step 3
For example:
- weight = 200 pounds; 200 x 0.45 = 90.0
- height = 72 inches; 72 x 0.025 = 1.8
- 1.8 x 1.8 = 3.24
- 90.0 / 3.24 = 27.8
[ Home | Statistics | Algorithm
| Architecture | Application | Glossary
]
|


