|
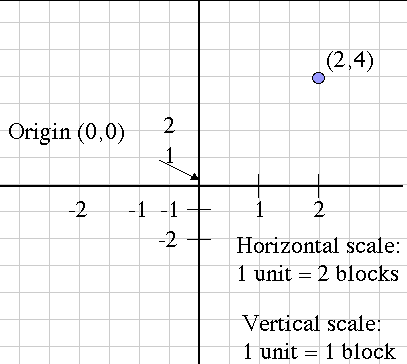
This applet allows the user to input a series of (x,y) ordered pairs and plot them either as a connected function or unconnected data points. Parameters such as minimum and maximum x value, minimum and maximum y value, and x- and y-scale can be set by the user or determined by the applet. The coordinate plane system was developed by a sick mathematician. As Rene' Descarte lay in bed sick, he saw a fly buzzing around on the ceiling. His ceiling was made of square tiles. As he watched, he realized that he could describe the position of the fly by the ceiling tile it was on. After this experience, he developed the Cartesian coordinate system in the 17th century to help visualize functions via plotting function values as ordered pairs. In this system a grid of evenly spaced horizontal and vertical lines is drawn, a center or "origin" is chosen, and horizontal and vertical scales are chosen. Here's an example:
 Notice that the horizontal and vertical scales are different, but each one considered alone is evenly spaced. Also, the blue point is labeled with its Cartesian coordinates, the horizontal and vertical movement from the origin, in that order. This is the mathematical convention for naming points.
Another name for the horizontal movement value is the abscissa, and the
vertical movement is the ordinate. These terms are more rare now than they used to be, but you might still hear them being used.
Classroom Resources
|

