Required Software
To open these system models, you will need to download Vensim, a free simulation software used for modeling. You can do so by searching up "Download Vensim Free" and fill out the form.
To run the model, go to the top bar and click "Synthesim". There will be arrows near each non-box variable that adjust parameters such as the birth rate.
Model 1: Just the Fish
In our first model, there are only fish, fish dying, and eggs making it to adulthood. There is a birth rate of 10% and a death rate of 10%. The number of fish that hatch and make it to maturity is modeled by Number of Eggs Laid*survival rate to adulthood while the number of deaths is modeled by Death rate*Adult Fish.
At the default survival and death rate, the number of adult fish intitially drops quite drastically and then steadily rises up. If the survival rate is increased, the number of adult fish doesn't drop as steeply. If the death rate is increased, the number of adult fish drops more steeply and rises back up even more slowly.
Download model file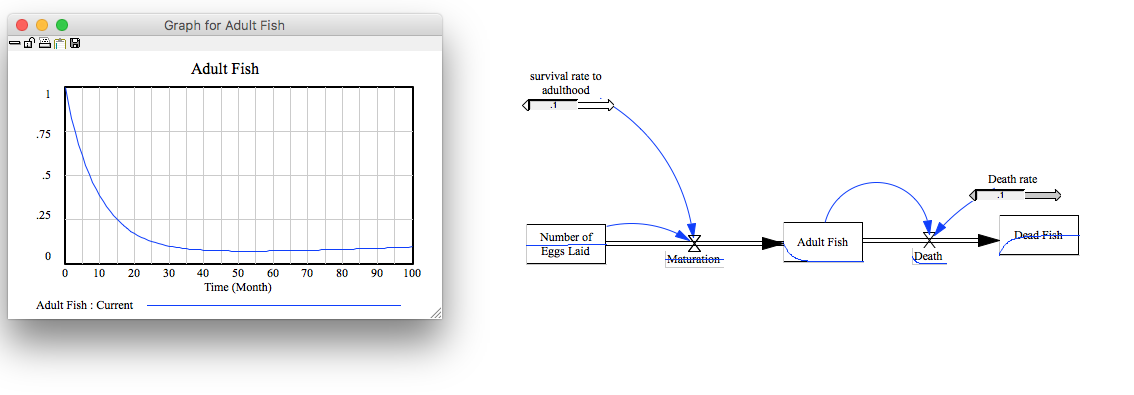
Model 2: Fish and Multiple Causes of Death
In the second model, there are multiple quantities - the number of eggs, the number of adult fish, and three causes of death. The death rate for each is 0.01 for each, along with the rate of eggs that mature. The rate of eggs that mature is modeled by Eggs Laid*Rate of Survival to Adulthood. Each death process is modeled by Adult Fish*0.01.
At the default survival and death rates, the number of adult fish exponentially decreases. If the survival rate is increased, the number of adult fish drops at a slower rate. If the death rates are increased, the number of adult fish drops at an exponentially quicker rate.
Download model file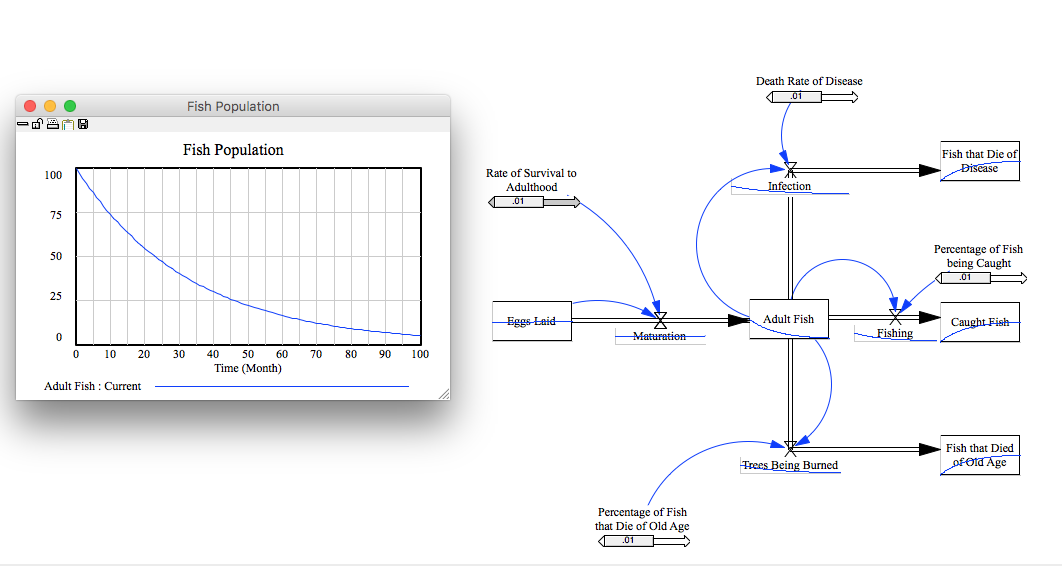
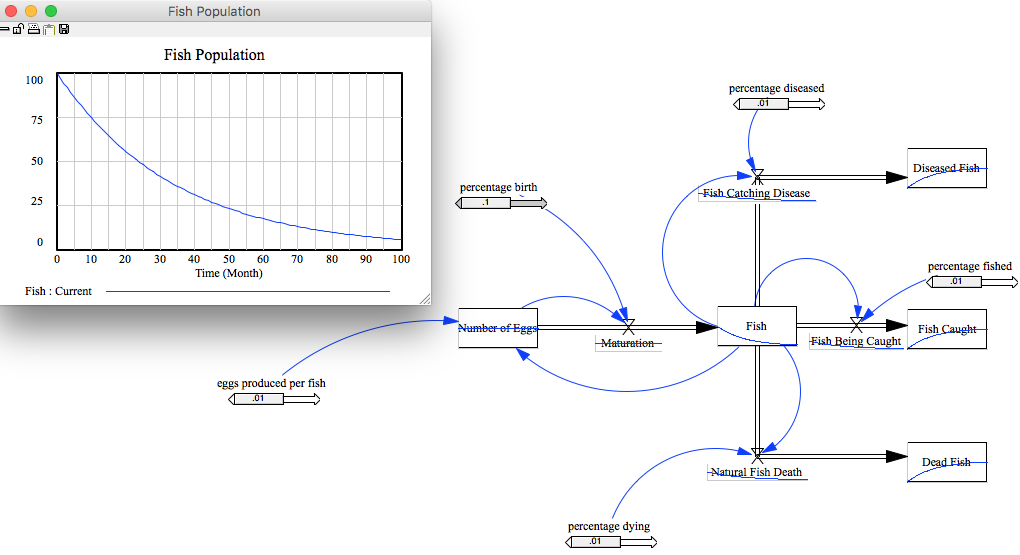
Model 3: Fish, Multiple Causes of Death and Related Birth Rates
In the third model, the number of eggs laid directly correlates to the number of fish. It is modeled by Number of Eggs*Maturation*eggs produced per fish*Fish.
At the default rates, the number of fish exponentially decreases. If the survival rate and number of eggs produced per fish are increased, the number of fish doesn't drop as steeply to the point where it almost shows signs of increasing at the end. If the death rates are increased, the number of fish drops more but at a far lower rate than the other graphs.
Download model file