elephant poaching models
This is the website for a system model and an agent model of the illegal elephant poaching issue in Africa due to the demand for ivory for the creation of ornaments and jewlery. The system model has been made with Vensim and the agent model has been made with AgentCubes.
High Level Design (HLD) Document |
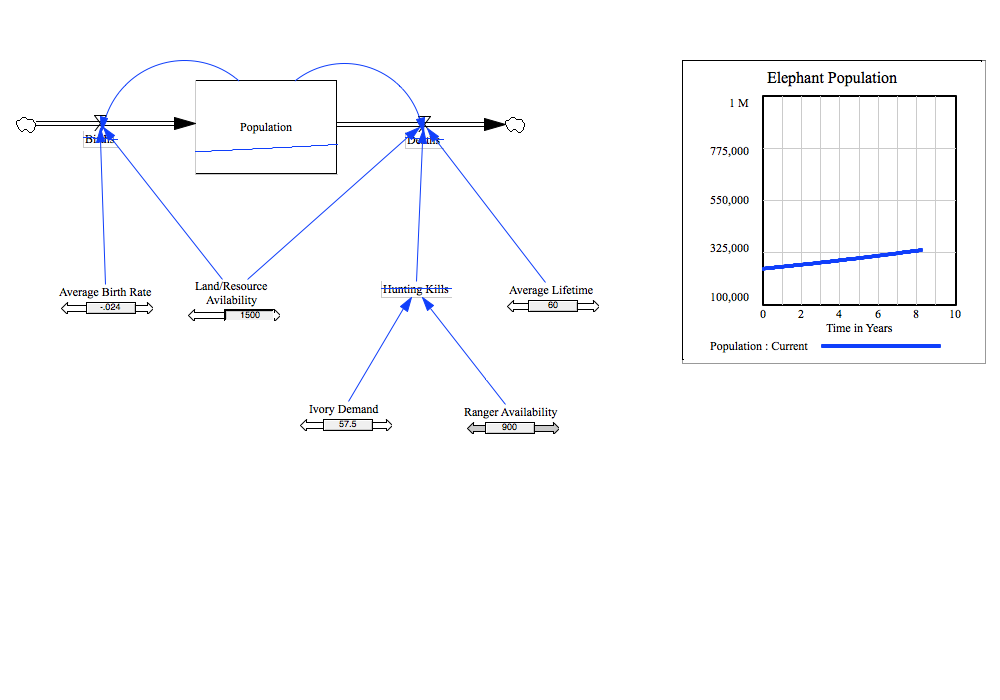
Vensim ModelThis system model depicts the elephant population in a certain area of Africa over a 10 year period. There is a rate pipe going into the population which represents the number of births, and there is a rate pipe going out of the population which represents the number of deaths. There are many factors that affects both the numbers of births and deaths. The variables afecting the births are the average birth rate and land/resource availability. These can both be controlled using the slider bars. Land/resource availability, hunting kills, and the average lifetime affect the number of deaths. Ivory demand and ranger availability affect the number of hunting kills. The average lifetime, ivory demand, and ranger availability can also be controlled with slider bars. The population change can be seen on the graph to the right as the values of each variable changes. I have noticed that there are some values that affect the population more than others. For example, increasing the average birth rate seems to have more of an effect on the population than increasing the land/resource availability. To try and break my model, I tried to mess with different variables and see what maximums and minimums would make the most sense for the slider bars. Sometimes, the graph would not load due to a floating point error and I would have to go in and fix it. Each of the slider bars affects the population in a way that would make sense in real life. For example, if the user increases the ivory demand, the number of hunting kills increases, which then decreases the population. Click on the text in the image to download the model. |
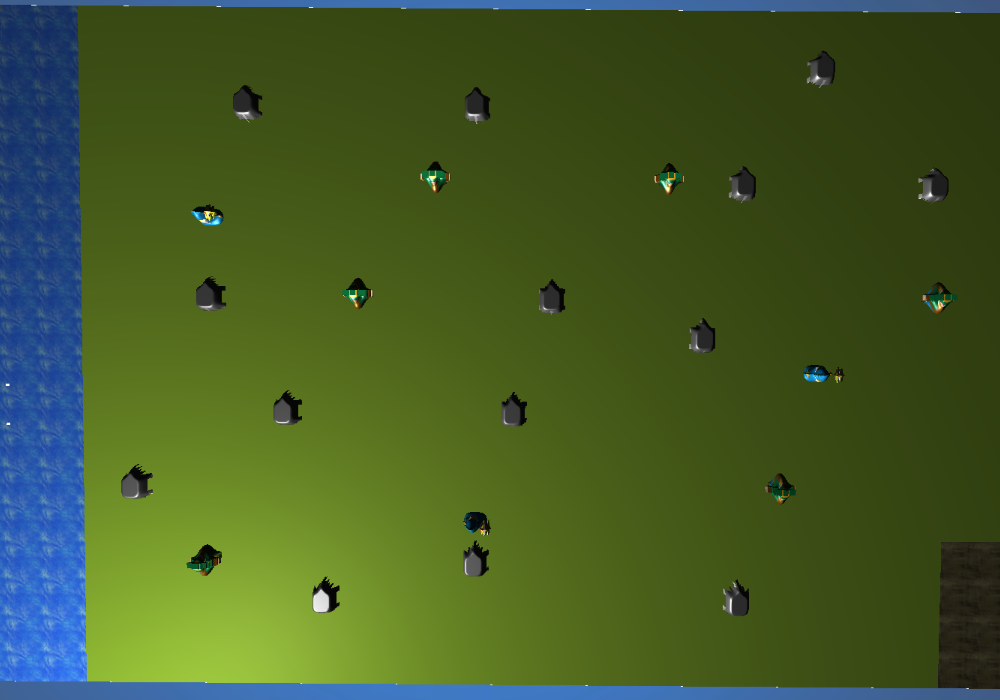
AgentCubes ModelThis agent model depicts the elephant population in a certain area of Africa as time goes on. Each time step represents approximately 1 month. Adult elephants, represented by the grey elephants, move randomly on the land. If two adult elephants are next to each other, there is a certain chance that they will create a baby elephant, represented by the pink elephants, after a certain amount of time. Baby elephants will follow an adult elephant. After a certain amount of time, the baby elephant will grow into an adult elephant. Poachers, represented by blue-coloured people, have a certain chance of killing an elephant if they are near one. If a poacher kills an elephant, they turn into a poacher with an elephant, represented by a black-coloured person, and slowly move to the water. When in the water, they will sail around for a certain amount of time before returning back to poach again. Rangers, represented by brown and green-coloured people, move randomly in the world, sending poachers with elephants to jail, which is in the bottom right corner. After a certain amount of time, an adult elephant will die naturally. A graph will appear when the user runs the model, showing the populations of each shape. Randomness affects the changes in the overall system because sometimes the elephants will all die out due to the poachers luckily being able to kill them all. The numbers are based on research I have done. For example, elphants die naturally after 720 time steps, because real elephants generally live to around 60 years old. To try and break my model, I messed with the percentages of the chance for each action to happen, such as the poacher catching an elephant. Click on the text in the image to go to the model. |