Required Software
To open these system models, you will need to download Vensim: a free software designed for creating models
To run the model, click "Synthesim," and you will be able to see the relationship between customers and sales as well as the impact external factors has on the model. To adjust parameters, such as the marketing factor, use the scroll bar to manipulate the variables and see how that impacts the relation between customers and sales.
Model 1: Customers
In this model, the only quantity is customers, and the model displays four different facotrs--marketing, good services, high prices, and competitors--that can cause the number of customers of a company to increase or decrease. There are 1000 potential customers, and the company already has 100 customers. Marketing and high prices can lead to a gain or loss in customers by 20 percent, and good services and competitors can cause their to be a gain or loss in customers by 5 percent. The total number of customers is found by calculating the difference between the number of customers gained and lost.
Initially, the graph is logarithmic, and at different scales, the rate of customers per month increases or decreases depending upon how much of an impact the different factors have on the customer.
Download model file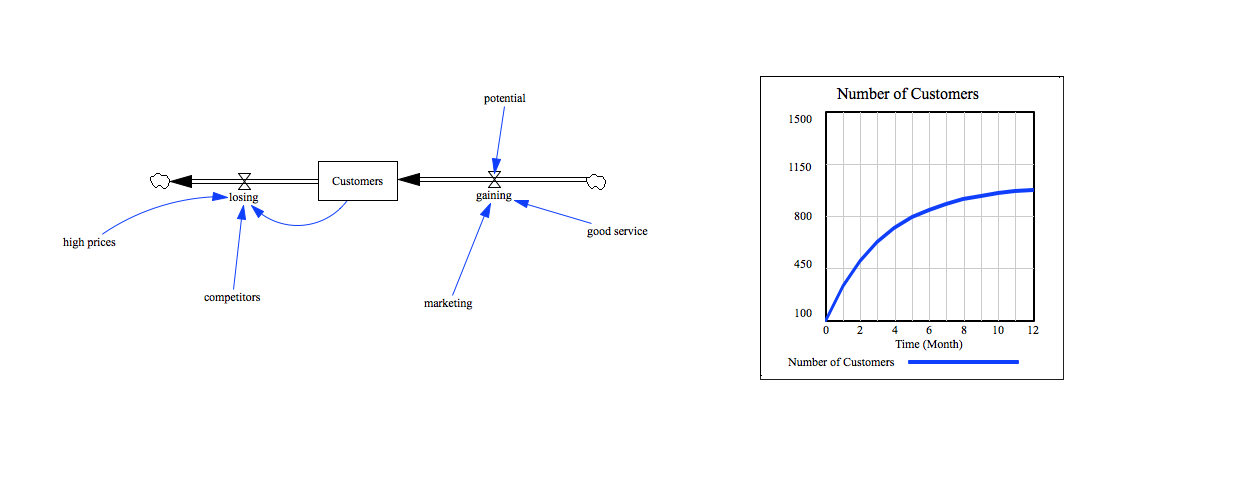
Model 2: Customers and Sales
In this model, the quantities are customers and sales. The model of customers is connected to sales to see how an increase/decrease in customers affects sales. There are 100 sales to begin with, and an increase in sales is dependent on the impact good services and marketing has on customers while a decrease in sales is dependent on the impact high prices and competitors have on customers.
Initially, the graph shows no sales while the number of customers is logarithmic. Once the user increases the marketing and/or good service factors, the sales increase, and the rate of number of customers increases as well. However, if the user increases the competitors or high prices factor, then the sales decrease and the rate of the number of customers decreases.
Download model file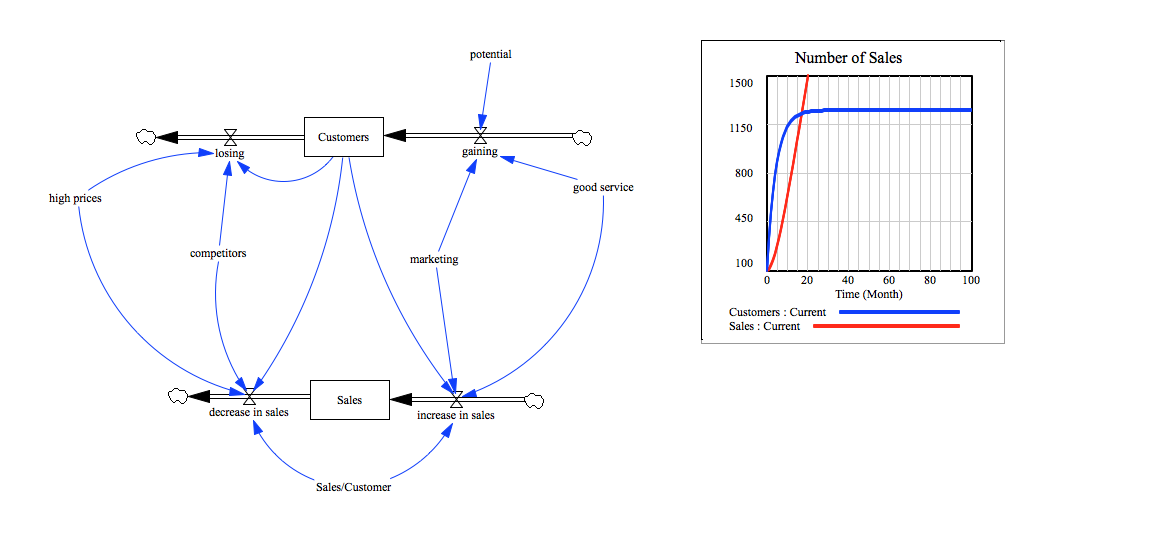
Model 3: Sales/Customers
In this model, the initial number of customers and the initial number of sales are introduced, so the number of sales made per customer can be manipulated. Initially, there are 100 customers and sales; however, the user can manipulate this amount.
At first, the number of customers is displayed by a logarithmic function while the number of sales is displayed by a linear function. If you increase the number of initial sales or customers, then the number of customers and sales increases and vice-versa.
Download model file