 Stimulating
Understanding of
Computational science through
Collaboration,
Exploration,
Experiment, and
Discovery for students with
Hearing
Impairments Stimulating
Understanding of
Computational science through
Collaboration,
Exploration,
Experiment, and
Discovery for students with
Hearing
Impairments |
|
|
For Teachers!
Forests,
Mining Carbon from the Air
Notes on teaching the lesson:
This lesson uses a professional forestry model to explore the movement of
carbon between the atmosphere, forest and forest products. The model allows the
students to change a number of variables within the model to explore different
forest management practices. In addition to learning about the carbon cycle the
students learn how to mine data. The data in the model is displayed as two
tables. The students copy and paste the data into an Excel spreadsheet where
they manipulate and graph the information. The model is a free download.
Answers to questions.
Trees grow by taking CO2 from the air and water and minerals from the soil. They use sunlight for energy to change
these raw materials into wood and leaves. The treeâs growth depends on the type of tree, rainfall, soil conditions,
latitude, elevation, competition from other trees, etc. Trees also grow slowly. Some trees grow for centuries or even
thousands of years. To find how fast trees sequester CO2 we need to look at different combinations of these factors.
We would need hundreds of test plots. Since trees grow slowly we would need to wait years to see the results.
Fortunately many scientists have been experimenting with trees. One scientist looked at the effect of rainfall, a second
scientist looked at soil conditions, etc. Each scientist
maked an equation to predict the effect of his/her factor. If we put
these equations together, we can predict how different kinds of forests grow. There are many equations. Doing all of the
math would take too long and be too confusing. If we put the equations together in a computer program the computer
will do the math for us. We call this kind of program a model. Doing science using these models is called
Computational Science.
We will use a forest model made by Wageningen University and Research Center . The model simulates a hectare plot.
A hectare is about the size of 2 football fields. After all of the variables are put in the model we run it. The model reports
on the carbon in the forest for the next 300 years. There are 2 sets of data. One set gives the carbon stored in different
parts of the forest. One part of the forest is the roots of the trees. These are called the stocks. The second data set gives
the carbon that is moving into and out of each part. These are called flows.
The questions we want to investigate are:
Where is the carbon stored in the forest?
How do these carbon reservoirs change over time?
What can we do to increase the carbon stored in the reservoirs?
Ask your teacher if you will be using CO2fix, This is the model made by Wageningen University and Research Center ,
or the Excel version.
In CO2fix open the model named WUR-ex1. When WUR-ex1 opens you see the carbon stock table. This is the run
for the forest plot. Each row is one year. How many years does this run model the forest?
300 years What parts of the
tree does the model monitor? Stems (trunk), foliage, branches,
roots. What is the total dry mass of the trees when the
simulation starts? .64 Mg/ha Mg is a metric ton or a million
grams. What is the total mass of the trees at the end of the
simulation? 433.52 Mg/ha
Copy the Biomass dry weight column into an Excel spread. Graph the column to see how the mass changes over time.
The biomass increases rapidly for the first 35 years as
the forest starts to grow. Then the biomass increases at a moderate rate until
year 100. Next the amount of Biomass levels off and starts to decline about year
120. There is a gradual decline in the biomass for the remainder of the run.
What percentage of the Biomass is carbon?
50%
Find the column that shows the total carbon in the soil. Copy this column to your spreadsheet and graph it.
Which year has the most carbon in the soil?
year 0, at the beginning of the experiment. Explain why the soils carbon dips then increases then decreases again.
The carbon is constantly decomposing and changing back into CO2. In the first years the trees are small and produce very few needles and debris. The carbon in the soil is disappearing faster than it is being replaced. As the trees mature they produce more debris and the amount
of carbon in the soil increases. When the trees
reach maturity their production of needles and debris levels off and starts to decline slightly with increasing age. The soil C level mirrors this gradual decline.
Explore the data on your own to answer these questions.
Which year has the largest amount of carbon in the forest?
121 How much carbon is in the forest this year?
390.29 MgC/ha
Which year is the most carbon being sequestered?
Look at the flows chart. Copy the atmosphere increments and losses columns onto a spreadsheet. In a third column calculate the difference by subtracting the losses from the increments. In year 20 the atmosphere lost 6.91 MgC/ha. The forest stored this 6.91 Mg. It is important that the students differentiate between the total carbon stored during a year and the change in carbon during that year.
Which year does the forest start producing more CO2 than it is sequestering?
year 122
After the year when the largest amount of carbon is in the forest what is the relationship between the forest and the atmosphere?
The atmosphere starts putting more C02 into the atmosphere than it is
removing. Is the forest removing or adding CO2 to the
atmosphere? Adding The trees are getting bigger and older why doesnât the forest contain more CO2?
Tree growth slows but doesn't stop. There is more damage to the trees, increasing the litter on the soil, thus increasing the C02 the soil produces. Some trees die and slowly rot to produce more CO2.
Which age range of forest would we need to help balance the CO2 that we are adding to the atmosphere?
Young forests. With this kind of tree, Norway Spruce, 6 < forest > 121 can sequester Carbon. Between 12 and 50 years old is the best.
What implications would this have on our national forest policy if we want the forests to help deal with our CO2 responsibilities.
We should consider harvesting some of our forests to keep them young. We haven't explored the effect of harvesting forests on the carbon balance, so we can't draw conclusions yet but we should look into it.
What are the product values in the model?
0 (all 0) this forest isnât harvested. It is managed like a wilderness area.
Lumber is removed from most of our forests. This model allows us to simulate harvesting of products from the forest.
The authors of the model suggest you practice thinning your forest by following these directions.
Open ÎWUR-ex2.co2â you will start to manage the forest and produce wood products
Go to the biomass parameterisation module, and choose the Îthinning harvestâ tag
Parameterise two thinnings (year 30 and 60) and one final felling at age 100. Fraction removed is resp 0.25, 0.25, and
1.
Allocate of first thinning, .1 to logwood, and .7 to pulp-pap
Allocate of second thinning, .3 to logwood, and .6 to pulp-pap
Allocate of final felling, .7 to logwood, and .2 to pulp-pap. Leave the rest of the cells as they are, i.e. all branches are
allocated to slash.
Now choose ÎApplyâ and ÎOKâ
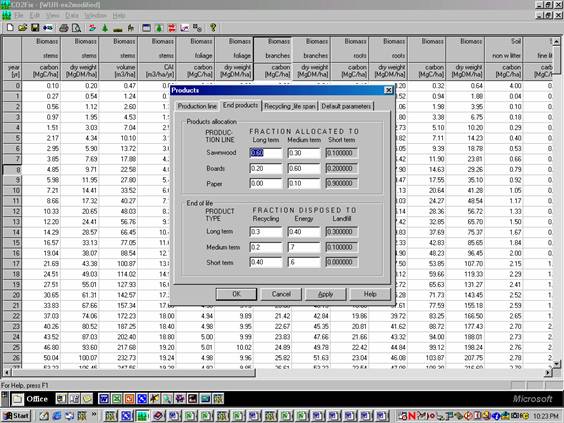
Go to Îproducts parameterisation moduleâ. This has now been parameterised for you. Try to get an idea what has been
inserted for products.
What fraction of products in long term use will be recycled at the end of their life?
What fraction of recycled products in long term use, will go to products with a medium term use?
Now choose ÎApplyâ and ÎOKâ
Under the icon ÎView optionsâ choose the Îproductsâ. Analyse what you see.
Go back to the Îview carbon stocks tableâ, and copy the column with the total products carbon stock into an excel
sheet.
Graph this column. Explain the curve i.e. why does it spike up and then curve back down again over and over again?
When the forest is harvested the carbon is removed to make paper or lumber. Over time the paper
etc. is used and discarded to return to C02 in the air. Some of the product is recycled. Over time less is available to be recycled and also to change back to C02
Is there an overall trend? Some of the product remains from the previous harvest so the
subsequent product levels are larger than the initial ones.
On the stocks table copy the column with total atmosphere C. Graph the atmospheric and products C together. What patterns do you
see? Both are variable so how can you find a pattern or trend that they share?
The products increase at the same time the atmospheric C02 increases and they decrease together. Stated an other way, as the products increase the sequestered C02 decreases. Sequestered C02 and products are approximate mirror images of each other.
The atmospheric levels rebound from the rush of a harvest more gradually.
Both have minimum values at 100 year periods. If you graph these minimum values you will see a relationship.
What should we conclude about the forests ability to permanently sequester our carbon?
It may be able to hold the
carbon but the rate on additional sequestration declines with time.
If you are using the downloaded model you can ask your students to change the run from 300 years to 500 or 600
years to see if the trend continues.
Suggest ways to change our forest management strategy or product recycling policy. I.E. should we harvest on a
different schedule, harvest part of the top of the trees into pulp, have a recycling
campaign? You need to justify the
practicality of your policy changes.
Many different options are available to the students. One of the most effective changes is to change the final product
values. Click on the chair. Change the Energy values to .1 instead of .4, .7,
and .6. That changes the final disposition of part
of the products from burning for energy to landfill.
Developed by
 The Shodor
Education Foundation, Inc.
The Shodor
Education Foundation, Inc.
Copyright © 1999-2001 by The Shodor Education Foundation, Inc.
This project is supported, in part,
by the
National Science Foundation
Opinions expressed are those of the authors
and not necessarily those of the National Science Foundation.
|

|
Last Update: Saturday, 16-Feb-2002 13:29:11 EST
Please direct questions and comments about this page to
krobertson@shodor.org