 Stimulating
Understanding of
Computational science through
Collaboration,
Exploration,
Experiment, and
Discovery for students with
Hearing
Impairments
 Stimulating
Understanding of
Computational science through
Collaboration,
Exploration,
Experiment, and
Discovery for students with
Hearing
Impairments Stimulating
Understanding of
Computational science through
Collaboration,
Exploration,
Experiment, and
Discovery for students with
Hearing
Impairments |
a collaboration of the Shodor Education Foundation, Inc., Eastern North Carolina School for the Deaf, Barton College, the National Technical Institute for the Deaf, and
Interpreters, Inc.
|
|
Search
|
For Teachers!
A note to teachers
Daphnia and Algae: a Study of Pond Dynamics
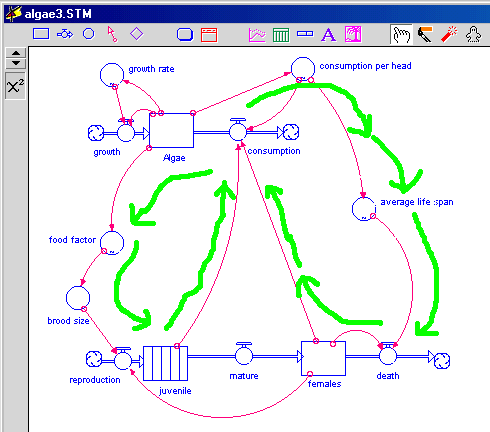
This page walks you through the student pages "What does the model look like?" and
"What experiment can I do with the
model?"
The student questions are in
red. The answers are provided on this page in blue.
Background
This lesson explores some of the relationships between algae and daphnia.
Algae and daphnia live in ponds and puddles. Algae have chlorophyll. That helps them make sugar. It also makes
the water green. Algae are small. You need a microscope to see them.
Like plants algae need light and nutrients to grow. The nutrients are dissolved nitrogen in the form of nitrates, other
minerals and CO2. The nutrients come from bacteria that break down plant and animal wastes. If the water has a
lot of nutrients in it the algae can grow quickly, doubling in number every day. As they consume the nutrients their
growth slows. In a classroom aquarium you can supply the nutrients with dirty water from a fish tank. Every week
when you do a water change in the fish tank put some of it in the algae tank.
The algae get energy from sunlight. If the pond isn't under trees it gets plenty of sun in the summer. In the winter
there is less sun so the algae grow slower. You can grow algae in your classroom or home. Put a glass jar or tank
in a window that gets sun light. Fill the tank with dirty water from a fish tank. Some of the water will evaporate.
Add more fish water to keep the tank full. Over the next few weeks the algae will multiply. The water will become
dark green.
1 When the water is dark green will all of the algae receive the same amount of light?
No, the algae on the top and next to the glass will absorb the light and cast a
shadow on the algae below and behind them.
Temperature also effects alga growth. As the water temperature falls below 70 degrees the algae grow slower. As
the temperature approaches freezing the algae stop growing.
Algae Model
Algae Growth
In our model each algae represents 1,000 algae. We start with 210 algae in the model.
Daphnia
If all conditions are perfect daphnia live approximately 50 days.Analysis
Your teacher will show you the model and or give you a graph of its predictions. Use the graph to work through the
Extension
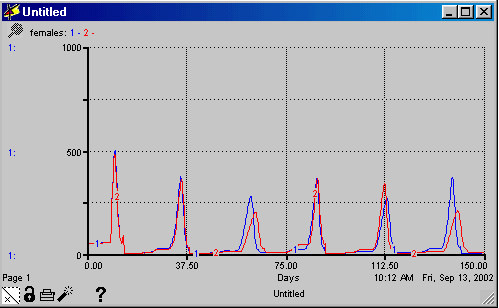
If you click on the graph numbers appear under algae, females, and replacing days. As you slide the cursor over the| algae maximums | 930,330 | 978,920 | 983,810 | 974,730 | 984,210 | 973,360 |
| algae minimums | 1.66 | 0.73 | 1.30 | 0.68 | 1.40 | 0.69 |
| daphnia maximums | 499.14 | 371.01 | 276.85 | 363.20 | 270.90 | 368.25 |
| daphnia minimums | 0 | 0 | 0 | 0 | 0 | 0 |
| juvenile maximums | 6,171.34 | 6,366.18 | 6,147.42 | 6,370.45 | 6,124.01 | 6,375.99 |
| juvenile minimums | 22.66 | 11.25 | 21.63 | 10.72 | 23.46 | 12.91 |
17 If the daphnia drop this low, how can they increase again?
There are a few juvenile daphnia left in the conveyer. Each day a few of them
mature. They don't show up because they die due to lack of algae. When the algae
level starts to rise, some of the new daphnia females survive and have broods, and
the numbers start to rise again.
Double click on the table 1 icon. This opens up a table of the runs data. Moving the scroll bar up and down allows
you to examine the entire run's data. This table also gives the number of juveniles.
18 What are the minimum and maximum values for the juveniles? See
table above. Describe how the female and juvenile numbers
change relative to each other. In general
they rise and fall together. The juveniles hit their maximum a day or so later
than the females. The juveniles hit their minimum after the females start to
increase again.
This model simulates a pond with plenty of nutrients. The algae can grow at their maximum rate, doubling every day.
This would simulate a pond in a forest or wetlands. You can change the model to simulate a pond in town next to a
parking lot. In your city pond, there will be fewer nutrients. Fewer nutrients will reduce the algae's maximum growth
rate. The maximum number of algae will also be reduced.
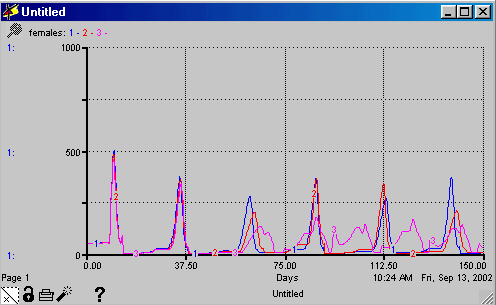
You want to compare the two ponds. STELLA will help you do that. Open a new graph by clicking on the pink
graph pad in the tool bar. Clicking on a blank place on the screen will open the graph pad. Double click on the graph
to open its editing mode. Click the Comparative box. Double click the females to select it.
Run the model again to record the female values.
Open the growth rate converter by double clicking on it. Change the maximum number of Algae from 1000 to
900.00 and hit enter. That changes all of the values in the Algae column. Next change the maximum growth rate from
1.000 to 0.900. Change the first 4 values for growth rate to 0.900.
Run the model again.
19 Describe the change in the daphnia values in the two ponds.

Except for the fifth peak, the second run (.9 max) has
lower values, the third and sixth being significantly lower. There is some
variability in both runs. The second run (less fertile water) has more
variation.
You can make more changes to the growth rate and see what effect it has.
This is the graph produced with the growth rate values at 800 and .8.

 The Shodor
Education Foundation, Inc.
Copyright © 1999-2001 by The Shodor Education Foundation, Inc.
|
by the National Science FoundationOpinions expressed are those of the authorsand not necessarily those of the National Science Foundation. |

|