|
a collaboration of the
Shodor Education Foundation, Inc.
, Eastern North Carolina School for the Deaf,
Barton College
, the
National Technical Institute for the Deaf
, and
Interpreters, Inc.
|
|

|
Home
|
For Interpreters!
|
Search
|
Peppered Moths
Modeling
In the 1950s England and the United States enacted legislation to reduce air pollution. As the pollution in the countryside has gone down the ratio of dark to light peppered moths has returned to pre-industrial levels. | |
Scientists did the best experiments they could think of at the time. No experiment is ever perfect. Scientists always look back at experiments and think, "If I had done this part a little differently, the results would have be more convincing or I would have learned more." When scientists have time they try the experiment again with the changes to improve their understanding. | |
Scientists are running out of time and opportunity to do more experiments on peppered moths. There are very few dark peppered moths left to observe. What new experiment can you do to explore the rise and fall of dark peppered moths? | |
You can't repeat these experiments in the classroom. It takes one year and many hours of collecting and feeding leaves to raise the caterpillars. You don't see the moths until the second year. The moth population changed over a period of 50 years. You will all be retiring in 50 years. | |
You can use a computer model to simulate natural selection through selective predation. Ask your teacher for the Stella model called "mothimm." | |
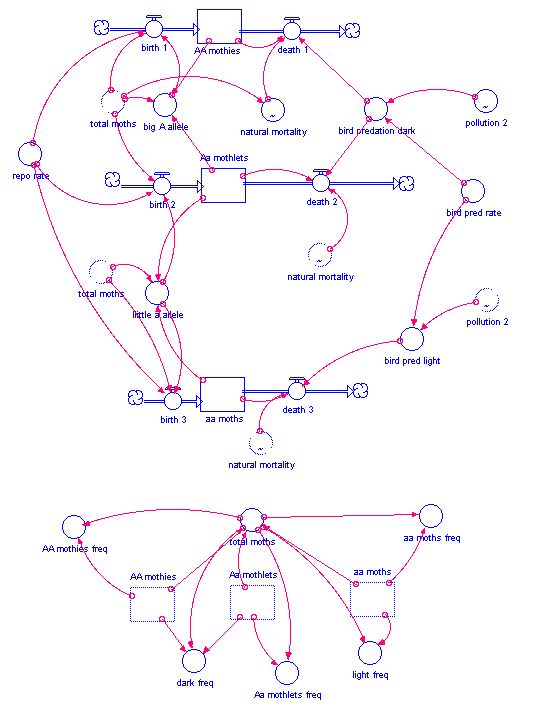
This model's algorithm is similar to the model that explored mutation. The mutation flows have been removed and bird predation has been added.
| |
The converter pollution 2 is a graph function. The graph holds the pollution values that simulate pollution levels in England for the last century and a half. The pollution starts at 1. In year 74 the pollution starts to fall. After 20 years it reaches 0 and stays at 0. | |
The converter "bird predation dark" does the calculation: bird_pred_rate-(pollution_2*bird_pred_rate). The theory says that it is harder for birds to find dark moths when there is pollution. The additional bird predation rate is lower when there is pollution. | |
The converter "bird pred light" does the calculation: pollution_2*bird_pred_rate. When there is pollution (pollution =1) the additional predation is bird_pred_rate. When there isn't any pollution (pollution =0) there isn't any extra predation. | |
If you don't have the Stella model you can use a Java version of the same model. Use this button to open the Java model.
| |
Click the up triangle to go to the interface page. Set immigration to 0. Click the run button to run the model. | |
The graph shows the frequency of the dark moths, the frequency of the light moths, and the level of pollution. The frequency of dark and light moths can range from 0 to 1. If the frequency is 1 then all of the moths are that type. If you drag the mouse onto the graph and right click numbers appear under the variables: "dark freq", "light freq", and "pollution". As you move the mouse left and right across the graph you can see the values of the variables at different times in the simulation. | |
Does the model's results match the data that was observed in England? | |
All of the communities in England didn't see the same change in peppered moths. Some rural areas had very little change in phenotype frequency. Even in the industrial areas the phenotype frequencies varied. Some polluted industrial areas saw a 50% maximum frequency of dark peppered moths. Others saw a maximum of 75%. | |
Scientists need to explain why two polluted areas can have different phenotype frequencies. Some scientists suggested that peppered moths immigrated into and out of polluted areas. Depending on the phenotype ratios in surrounding areas and the amount of immigration different phenotype frequencies would be observed. | |
Scientists know that male peppered moths can fly a few kilometers each night. Scientists have also observed that peppered moths make a silk kite after they hatch from an egg. The newly hatched larva, use these kites to fly across the countryside. Scientists don't know how far they fly. | |
Why can't scientists observe the immigration of peppered moths? | |
The model "mothimm." simulates the immigration of peppered moths. Each of the phenotypes, AA, Aa, and aa, has a flows that simulates moths immigrating into and emigrating out of the area. The converter called "immigration" controls the amount of immigration and emigration. | |
Continue to adjust the immigration slider. Try to simulate conditions that result in maximum dark frequencies that range from 50 to 98%. Record your results in a table. | |
Scientists suggested that the variation in maximum dark moth frequency could be explained by immigration. Does the results of your simulation support this suggestion? Does your simulation prove this suggestion? | |

| <<< Back | Forward >>> |
|---|---|

Developed by
The Shodor Education Foundation, Inc.
Copyright © 2002 by The Shodor Education Foundation, Inc
This project is supported, in part, by the National Science Foundation
Opinions expressed are those of the authors and not necessarily
those of the National Science Foundation.