Page 4
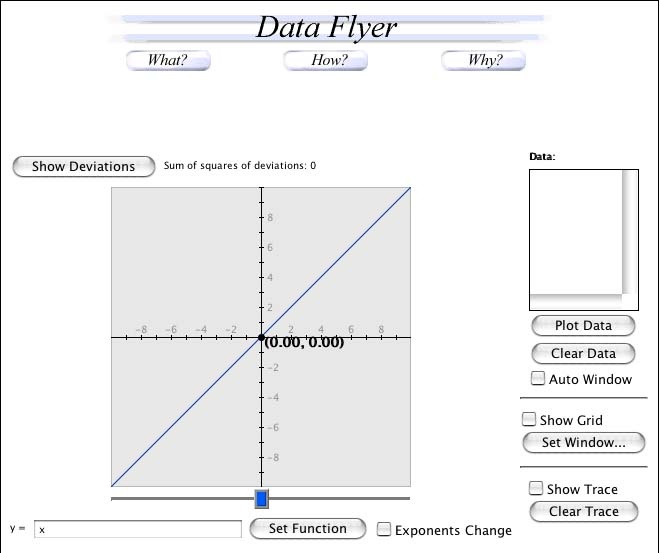
Graph DataLet's open the Data Flyer. The Data Flyer will allow us to plot our data points with a function in order to better understand our data.
Let's plot the Mass vs. Volume of the boxes of different cuts to better
understand the relationship between mass and volume. We are going to
use an ordered pair, or 2 numbers where the order is important. 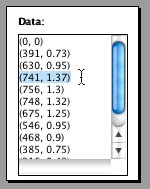 Enter
in volume as the first number and mass as the second number. For
example, say your volume value for cut 3 is 741 units3,
and the value for mass is 1.37 kg.
The ordered pair that you enter in the "Data" would be
(741, 1.37). Enter all of your data points like this for each cut.
Make sure to include the point (0, 0) because if the box doesn't have
any volume, no sand will fit into it.
Enter
in volume as the first number and mass as the second number. For
example, say your volume value for cut 3 is 741 units3,
and the value for mass is 1.37 kg.
The ordered pair that you enter in the "Data" would be
(741, 1.37). Enter all of your data points like this for each cut.
Make sure to include the point (0, 0) because if the box doesn't have
any volume, no sand will fit into it.
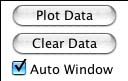
Click "Auto Window" so that we have an appropriate range of x and y, so that we can see the pattern of our data. Then, click "Plot Data" to view the graph. What pattern do you see? The points look like they make a line.
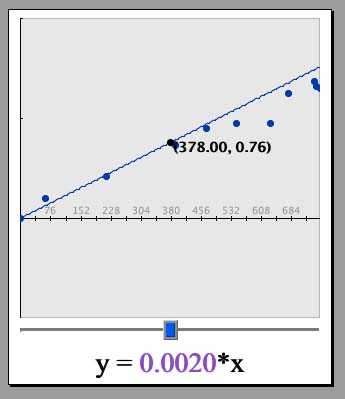
Volume vs. Mass
Let's plot a line on the data and then find an equation that is the "best-fit." Lines follow the general equation y= mx + b, where m is the slope and b is the y-intercept. Our y-intercept is 0, so we will only change the slope.

Type in 0.002*x in the box that says "y=". Then click "Set Function." Does this line adequately represent the data?
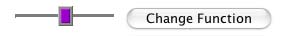
Find the purple box next to the button that says "Change Function." Move the box left to right. What happens to the graph? The steepness of the line changes! This change occurs because you are changing the slope. Look towards the top of the page where it says, "Sum of squares of deviations." This number also changes. Try to get this number to be small, the smaller the number, the better the line fits the data.
Try different numbers until you find one that fits. The line y= 0.0018*x is a good fit for the sample data. If you click on "Change Function," you can manually adjust the number. Can you find a "perfect fit?" Why or why not?
The line should not perfectly fit the data. There should be some human error because the mass was physically measured. However, the line tells us the general relationship between mass and volume.
| Find the Relationship! |
The 0.0018 in our equation represents y/x, or the slope. If we think about what the x and y values represent, we can see that the slope, y/x, is mass / volume. This value represents density. It is the mass per unit volume. What is the density (in kg per cubed unit) of the sand?
Density
Using our sample data, the density of the sand would be the slope in our equation, or 0.0018 kg per units3. In other words, we can hold only 0.0018 kilograms in a single cubic unit. A kilogram is 1000 grams, so we can hold approximately 1.8 grams in a unit.
| On to page 5! |
The Shodor Education Foundation, Inc.
Copyright © 2003