Ozone Source Apportionment Technology
Simply stated, improving air quality is at its most basic the reduction of harmful primary and secondary pollutants, such as volatile organic compounds (VOCs), nitrogen oxides (NOx), and ozone (O3). Control strategies are those mechanisms, evaluated through the use of air quality models, that work to reduce one or more pollutants, either primary or secondary. Getting the correct control strategy out of the hundreds of potential strategies is difficult and time-consuming.
The Ozone Source Apportionment Technology (OSAT) methodology developed for the CAMx model is an attempt to determine which source area, categories of pollutants, and pollutant types contribute most to ozone formation. Armed with that analysis, it is then easier to determine which controls to implement and which to ignore. For example, OSAT helps the analyst to determine that a particular source does not significantly increase ozone in the modeling region, therefore it does not make any sense to work to control that source, while other sources might contribute a larger amount to the overall formation of ozone, and need to be controlled.
|
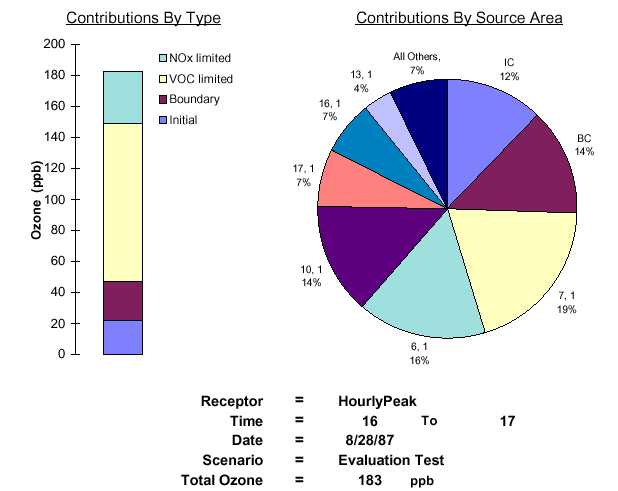
How this works might be best shown with the results graphic at right (click to see full size). The graphic is color-coded by four types of contributions: initial condition contributions, boundary condition contributions, and contributions that are VOC- and NOx-limited. In this example run, there are 17 source areas with one emission group. The data suggests that source area 17 (with one emission group) contributes the most to the ozone production, roughly 20%. This data might suggest that establishing a control strategy for this particular source area might be the wisest course of action.
One criticsm of the OSAT methodology is that since ozone formation is non-linear (that is: there are those occasions where increasing the amount of a primary pollutant results in the decrease of the secondary pollutant of ozone)
|
|