Gaussian Plume Models: Architecture

Gaussian plume models are well-known, well-used, and available in many forms. There are a wide variety of "named" models, such as RAM and the Industrial Source Complex (ISC) models, which are,by definition, Gaussian plume models. Some of these models are described in the next module on example atmospheric models.

An ever-increasing number of Gaussian plume models are available on the Web, in runnable form. The list below includes two such models, plus an example of a simple Gaussian plume model that is available as a downloadable Microsoft Excel spreadsheet file:

  • Java Gaussian Plume Model: this applet provides the user with a number of slider bars to modify initial conditions, including:
    1. wind speed
    2. stack height
    3. stack diameter
    4. emission rate
    5. gas temperature
    6. gas velocity
    7. atmospheric temperature
    8. atmospheric conditions
    9. 3D coordinates and graphics resolution
    The model provides output displays in several formats: x-y graph, top and side visualizations, and text-based output screens.
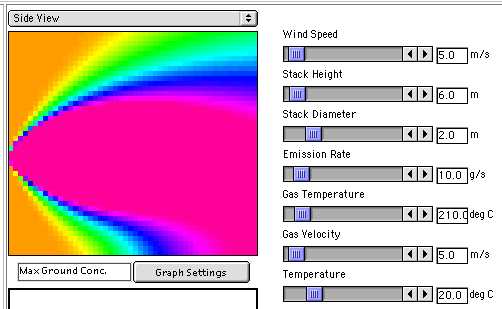
  • The graphic at right (click on image to see full-sized) shows a side-view of a plume for the conditions shown on the slider bars. Notice that this is a relatively short stack (six meters) with not much wind in stable conditions, so the plume emerges from the stack and then drops to the ground several kilometers downwind.

  • SO2 Gridded Gaussian Plume Model: this application provides a "case study" approach to the Gaussian plume model. In this case study, the user is asked to calculate the concentrations of SO2 in a small town, based on the point-source emissions over a grid, the wind speeds from various directions, and other key input parameters. Case study users are provided with information for building a spreadsheet model (using Excel or some other spreadsheet program) or they can use the online Javascript program.
  • Downloadable Excel spreadsheet: you can download an Excel spreadsheet for use in exploring the Gaussian plume model.
    Quick Quiz: Which of these Pasquill levels is the most unstable and turbulent air?
    A
    B
    C
    D


    Confused? Have a question? If so, check out the Frequently Asked Questions (FAQ) page or send mail to the OS411 tutor (os411tutor@shodor.org) with your question!
    Report technical/content problems here
  •