Graphing PackagesSpreadsheetsMany spreadsheets such as Excel and Quatro Pro can also be used for simple graphing. These packages are widely available for Mac and PC platforms and vary in how they are used. However, most have features for multiple line plots, scatter plots with or without error bars, histograms, and contour and surface plots. Data Manipulation ProgramsThere also exist commercial packages designed to have the ease of spreadsheet use with advanced graphing capabilties, enhanced ability to handle 3-D graphics and enhanced numerical support. Examples of these are SigmaPlot and Axum. These tools have extended data reduction capabilities and many of these packages will perform least squares analyses and other fitting routines for data. GnuplotGnuplot is a easy to use graphing package found on most UNIX machines. Its capabilities include Cartesian, polar, surface and contour plots. The advantages of gnuplot is its widespread use on UNIX platforms.At its simplest, assuming we have a set of data, a gnuplot session might look like this: This command tells gnuplot to find a set a data, and make a plot of that data using lines (versus points or dots). A variety of other examples, with the resulting plots, are included here: simple gnuplot demo# gnuplot> set termwill result in (gif mode) 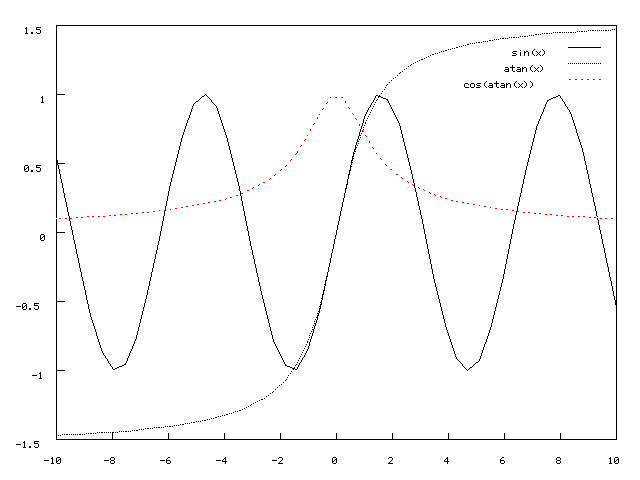
set samples 100
plot [-pi/2:pi] cos(x),-(sin(x) > sin(x+1) ? sin(x) : sin(x+1))
will result in (gif mode) 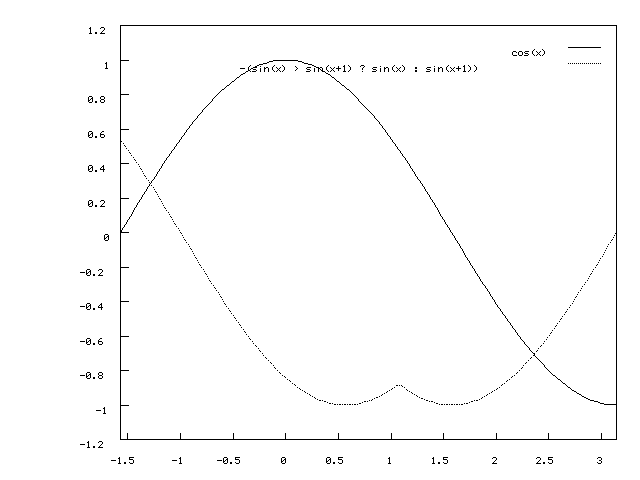
set samples 200
plot [-3:5] asin(x),acos(x)
will result in (gif mode) 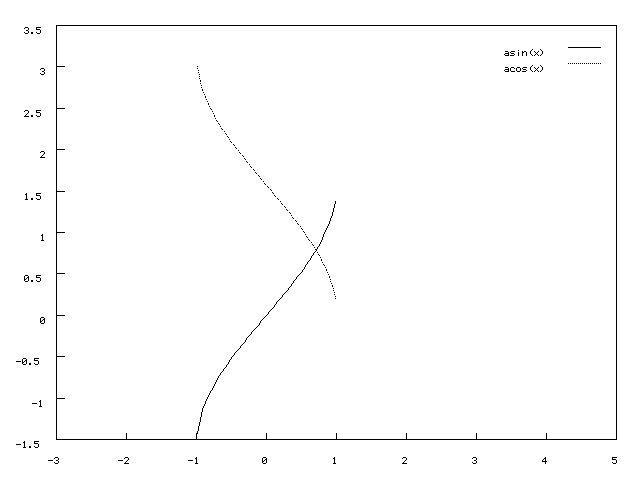
plot [-30:20] besj0(x)*0.12e1 with impulses, (x**besj0(x))-2.5 with pointswill result in (gif mode) 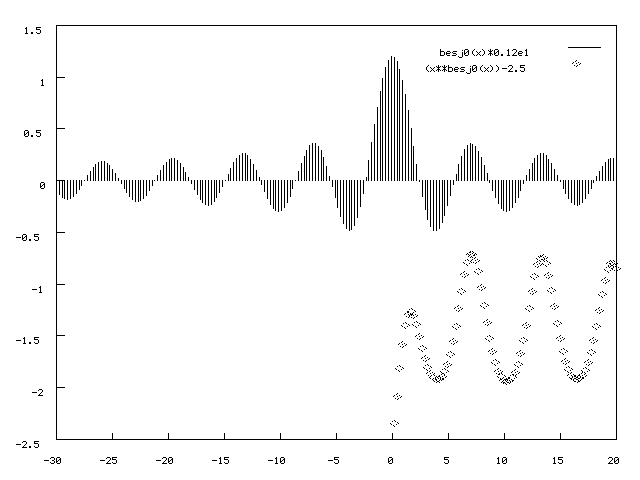
set samples 400
plot [-10:10] real(sin(x)**besj0(x))
will result in (gif mode) 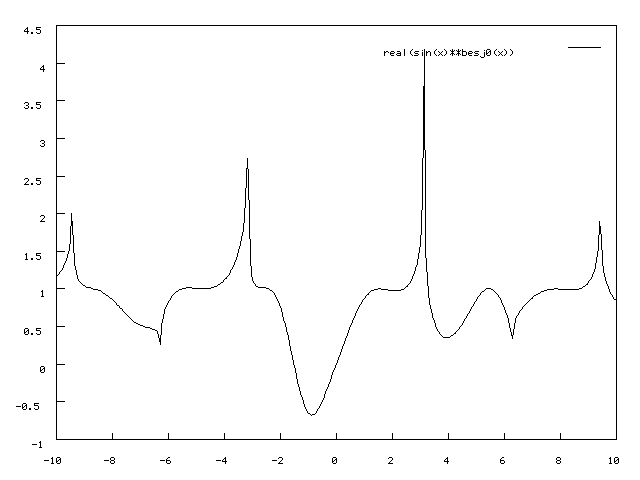
plot [-5*pi:5*pi] [-5:5] real(tan(x)/atan(x)), 1/xwill result in (gif mode) 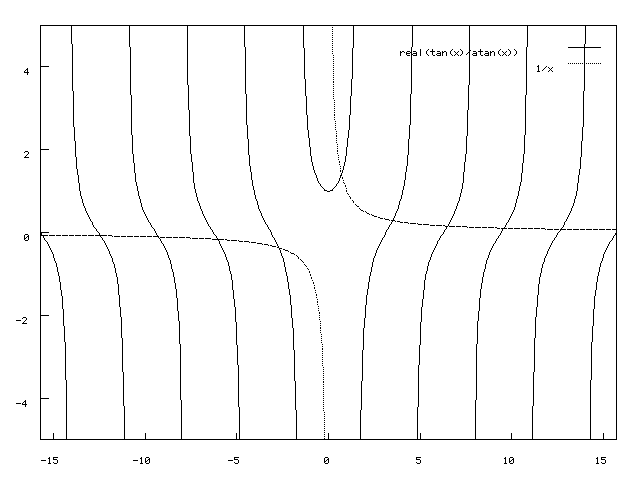
set autoscale
set samples 800
plot [-30:20] sin(x*20)*atan(x)
will result in (gif mode) 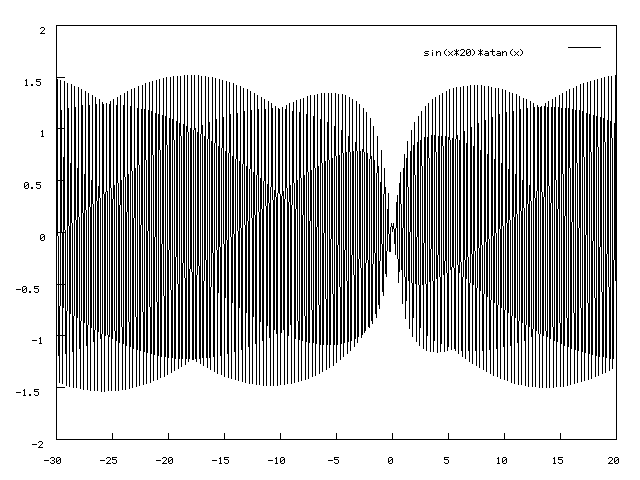
f(x) = x/100
plot [-19:19] '1.dat'with impulses ,'2.dat' thru f(x) ,'3.dat' with lines
will result in (gif mode) 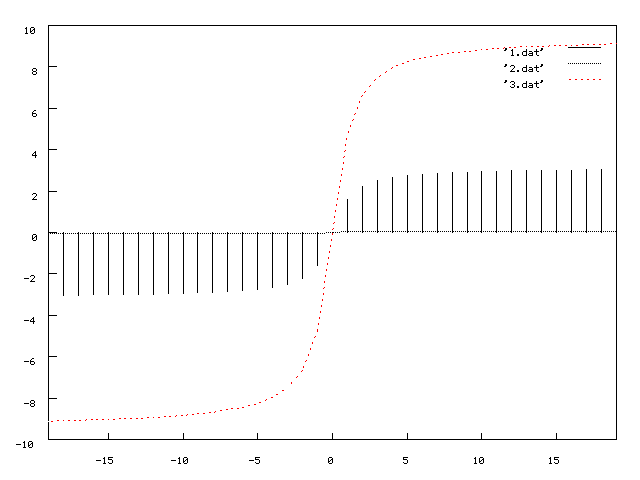
# undo what we have done above
set samples 160
set xrange [-10:10]
set autoscale xy
An interactive Web interface to Gnuplot is available here. Report technical/content problems here |