The Electron
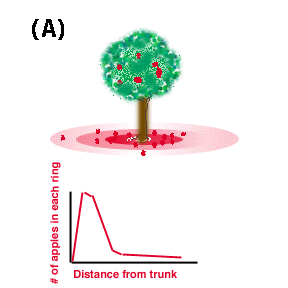
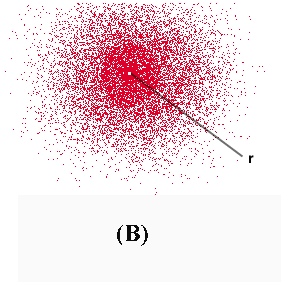
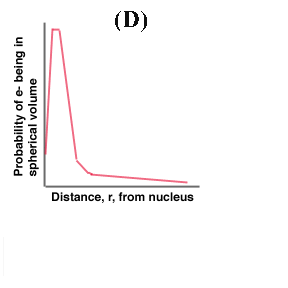
The idea of a quantized value is not difficult to analogize. When you climb a step ladder, your foot can only come to rest where there is a rung. You can move it above or below the rung, but to be on the ladder your foot must rest on a rung. The rungs could be described as being quantized, and you could say that your foot can only move in discrete quantized positions - on the rungs. Electrons move rapidly through a spherical volume centered on the nucleus. This frenetic activity is often depicted as a cloud with each point in the cloud representing a momentary position of the electron or electrons. If you are having trouble picturing this, you may find it helpful to watch and listen to this short animation showing the development of an electron cloud. This movie includes a sound track. As with the Bohr model, the higher the energy of the electron, the farther it will be from the nucleus. For convenience, atomic models are drawn as if the highest electron density will be found immediately adjacent to the nucleus. This is only a convenience. In fact, the closest electron is very far from the nucleus. 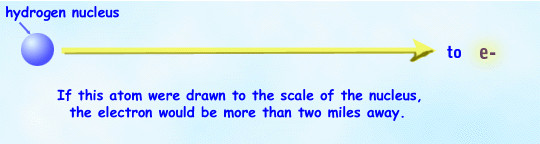 The precise position of an atomic electron moving around a nucleus cannot be predicted. However, a spherical volume centered on the nucleus where the electron(s) is most likely to be found can be calculated. A diagram showing the most likely location of the electron is called a probability density diagram. To picture this, look at the 4 images below. Consider the pattern of ripe apples falling from a tree as shown in figure (A). There are almost no apples that fall right beside the trunk of the tree. However, most of the apples will end up a short distance from the tree in all directions. As you move farther away from the tree, fewer and fewer applies will come to rest. You could say that the apple density on the ground is highest a short distance from the trunk and then becomes lower and lower as you move away from the tree. Now, imagine this distribution in three dimensions. It might be helpful to think of the layers of an onion. Any slice, or cross section of the sphere would show an electron density resembling the apple densities found under the tree. A diagram of such a cross sectional distribution of electrons around a nucleus is shown in figure (B). Finally, if the sphere were divided into 3 dimensional layers, like the layers of an onion, the density would look like figure (C). The graph showing the probability of an electron being in a given spherical layer would look like figure (D).
Report technical/Content problems here |
|
|