Using Residuals to Identify a Line of Good Fit
|
Mentor: In order to see whether a line is a good fit or a bad fit for a set of data we can examine the residuals of that line. Student: Why are the residuals related to determining if the line is a good fit? Mentor: Well, the residuals express the difference between the data on the line and the actual data so the values of the residuals will show how well the residuals represent the data. Student: OK, well what do I look for when I'm examining the residuals? Mentor: Well, if the line is a good fit for the data then the residual plot will be random. However, if the line is a bad fit for the data then the plot of the residuals will have a pattern. Student: How would data that forms a pattern look compared to random data? Mentor: Well, let's take a look at a set of data with a good fit and a set of data with a bad fit to see the difference. First, let's look at the residuals of a line that is a good fit for a data set. Using the Regression Activity, graph the data points: {(1, 3) (2, 4) (3, 3) (4, 7) (5, 6) (6, 6) (7, 7) (8, 9)}. Now, select Display line of best fit and select Show Residuals. Now you can see the Residual Plot of all of the residuals found when the predicted values of the line of best fit are subtracted from the actual values.
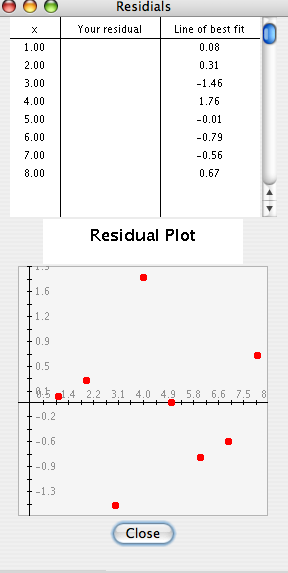
Student: The residuals appear randomly placed along the graph. I can see how this would be a random pattern of residuals. What would a residual plot look like for a line that was a bad fit for the data? Mentor: Well, let's look at another graph. Using the Regression Activity, plot the following points: {(4, -11), (3, -6), (2, -3), (1, -2), (0, -3), (-1, -6), (-2, -11)}. These points graph the quadratic equation -x^2 +2x-3. Now, select Line of Best Fit to plot a line to fit the data. Now select Show Residuals in order to view the residual plot that you want to examine.
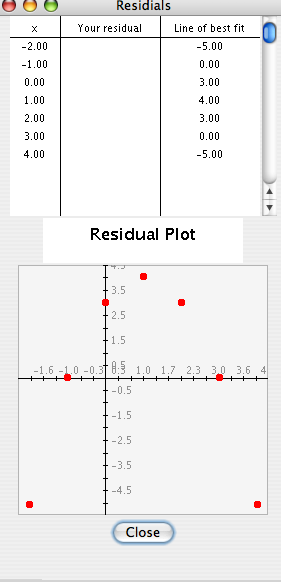
Student: Hey, the residuals form a pattern! They are definitely not randomly scattered, but instead they are making a curve. This line was not a good fit. Will there be times when I won't be able to tell if the residuals form a pattern or not? Mentor: Sometimes you will not have enough residuals to be able to see a definite pattern in the plot, but in most cases you will be able to look at the residual plot and, using this criteria, determine whether the line is a good fit or a bad fit for the data. Student: I noticed that the residual values (the values under Line of best fit) seem to have a sum of about 0. Does the sum of these residuals help determine whether a line is a good fit for the data or not? Mentor: The sum of the residuals does not necessarily determine anything. The line of best fit will often have a sum of about 0 because it is including all data points and therefore it will be a bit too far above some data points and a bit too far below some data points. Therefore, in the case of the line of best fit often the positive error will balance out the negative error so that the sum of the residuals will be approximately 0. However, this does not mean that the line is a good fit for the data; it only means that the line is equally above and below the actual data. Student: OK, now I know that in order to find out if a line is a good fit for a set of data I can look at the residual plot and if the residuals are a pattern then the line is not a good fit. |
