Plotting Functions in the Polar Coordinate System
|
Mentor: In the discussion on plotting points on the polar coordinate plane, we talked about plotting points on the polar coordinate plane. Well, just as we can plot functions on the Cartesian plane, so we can plot functions on the polar coordinate plane. Student: What would a polar equation look like? Mentor: In the Cartesian system, x is usually your independent variable and y is your dependent variable. In the polar coordinate system theta, or symbolically, θ, is usually your independent variable and r is your dependent variable. Student: Isn't that kind of backwards though from the Cartesian system? I mean in polar coordinates the dependent variable is listed first and in the Cartesian the dependent is listed second in the ordered pair. Mentor: Nice observation. This is definitely something to look out for. Why don't we try plotting a very simple equation where the dependent variable, r, is constant. Let's try r=3. This would be a graph of a circle with a diameter of 3 units. Do you know why? Student: Well, sure! This is because r represents the radius. And if r is 3, then it would make sense that for all values of the angle measure, it would have to form a circle. Mentor: And what equation do you think would create a straight line? Student: If a constant value of r creates a circle, then I guess a constant value of theta would create a line. Would θ=π/6 be a line? Mentor: Yes, nice work. Now let's try an equation that actually has the independent variable, θ, in it, say r=sin(θ). What would you do to plot this equation? Student: Well, for various angle measures I would need to find r, right? I could make a table, choose values of θ to evaluate and then input values of θ into the function to find my coordinate pairs. Then I could plot them on a polar graph. Mentor: You are right. There are many different types of equations that create beautiful shapes. A function like r=2+(3*sin(θ)) is called a limaçon. How would you plot it? Student: Well, I could create a table of values for this one too. I could make a table and input values of θ into the function to find out the value of r. My table would look like this:
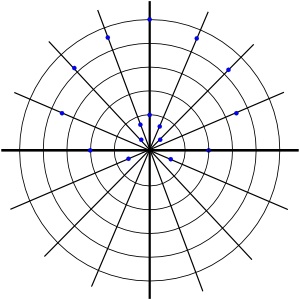
Student: Then I could plot the points on polar graph. The plotted points would look like this:
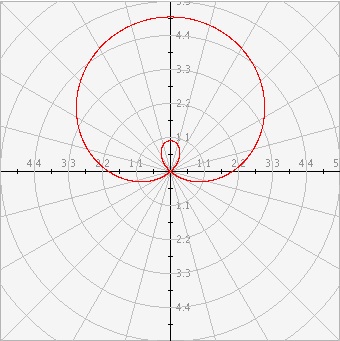
Student: But connecting them seems complicated! What if I missed some important values in my table? Mentor: That is a very good observation. It is often why we like to use computers because they can calculate many more points much more quickly than we can. Try plotting this function using the Polar Coordinates activity and see what you get. Student: Wow! That is a cool graph!
Mentor: Nice work. Any equation of the form of the formula a ± b*sin(θ) or a ± b*cos(θ) will create a limacon. Try a few more. Even simple equations like sin(a*θ) or cos(a*θ) can be interesting. Play with the values of a and see what happens. There are many interesting graphs you can make by plotting trigonometric functions in the polar coordinate system! |