Graphing and Interpreting Bivariate Data
|
Mentor: Now that we understand bivariate data let's look at a sample set of data. This data set has two variables, the arm-span variable and the height variable. Which do you think is the independent variable and which do you think is the dependent variable?
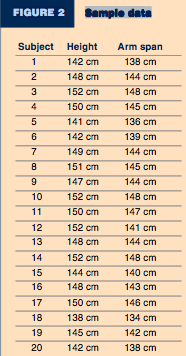
Student: Well, as a human's body grows taller the rest of their body must adjust to this growth. Therefore, I think that as you get taller your arm span changes and this means that height is the independent variable and that arm span is the dependent variable. Mentor: What you said makes a lot of sense, but this was actually a trick question. In some cases, such as this one, the independent variable and the dependent variable are difficult to determine. Both the arm span length and the height grow in relation to one another, but neither variable necessarily determines the other. Since neither variable is dependent on the other it is difficult to label one variable independent and the other variable dependent. While in most cases one variable is obviously dependent upon another it is important to keep in mind that sometimes this relationship is not able to be determined. Let's see the type of relationship that the two variables of arm span length and height have by using the Regression activity. We can plot the points and see what happens to one variable (in this case we will choose the arm span length to represent the dependent variable on the y-axis) as the other variable (in this case we will choose the height to represent the independent variable on the x-axis) increases. What type of relationship is this?
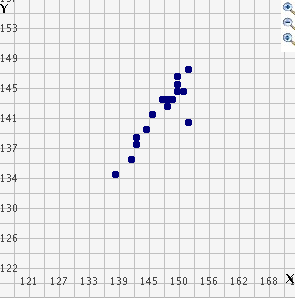
Student: It is a positive relationship because as the height of each student increases the arm-span length increases as well! Now I understand relationships that exist with bivariate data and how to view these relationships on a graph. |
