Finding Residuals
|
Student: What is a residual? Mentor: Well, a residual is the difference between the measured value and the predicted value of a regression model. It is important to understand residuals because they show how accurate a mathematical function, such as a line, is in representing a set of data. To find a residual you must take the predicted value and subtract it from the measured value. Student: What are the predicted values? How do you find that? Mentor: The line of best fit provides the predicted values for a set of data. For example, with the line of best fit the predicted value is the value on the line that corresponds to a specific independent value. Take a look at the graph. The y-coordinate values on the line of best fit match the x-values from the data set. Now let's use the Regression Activity to calculate a residual! First, let's plot the following four data points: {(1, 2) (2, 4) (3, 6) (4, 5)}. The labels x and y are used to represent the independent and dependent variables correspondingly on a graph. These given y-values (dependent variables) are the measured values for the specified x-values (independent variables). Now, let's graph the line of best fit by selecting Display line of best fit and see where the predicted values lie on the graph.
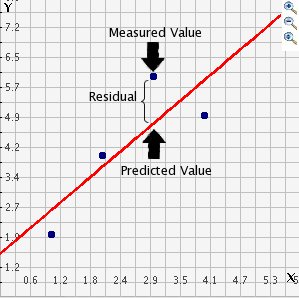
Student: Cool! Now I can see what you mean about the predicted and the observed values! Mentor: Great, now let's try to find the residual for the independent variable, x = 1. How would you do this? Student: Well, I would first write down the measured value for independent variable x=1, which would be 2 since I plotted (1, 2). Now, I see that when the x-value is 1, the y-value on the line of best fit is approximately 2.6. So, to find the residual I would subtract the predicted value from the measured value so for x-value 1 the residual would be 2 - 2.6 = -0.6. Mentor: That is right! The residual of the independent variable x=1 is -0.6. If you are having trouble remembering which value to subtract from which you can think about it this way: you are trying to see how far off the predicted value is from the actual value so you would want to take the actual value and subtract the predicted value to see how far off the predicted value is from the actual value. Sometimes the residual will be positive and sometimes it will be negative. When practicing finding residuals you can also use the Regression Activity and select show residuals to compare your findings. Student: Cool! Under the column X the value 1 corresponds with the number -0.6 under the column line of best fit. The residual is -0.6 for x=1, so do the numbers in the line of best fit column represent the residuals for each x-value? 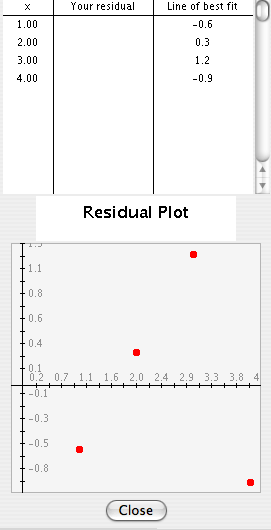
Mentor: Yes. Also, the Residual Plot graphs the residuals as the y-values with the corresponding x-values. The Residual Plot gives you a visual way of representing residuals of independent and dependent variables. Student: This is really helpful - now I know how to find residuals! |
