Correlation Coefficients
|
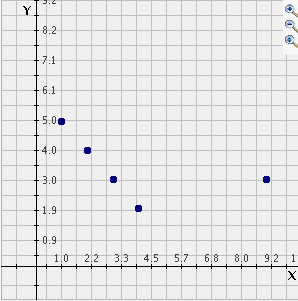
Student: So, what does the r represent? Mentor: The r represents the strength of the linear correlation coefficient. R can be between +1 and -1. In order to visualize this concept we can graph the points (1,2) (2,3) and (3,4) in the Regression activity. What do you see? Student: There is a straight line going up, and it says r=1. Mentor: Yes. This means that there is a very strong, positive correlation between the data points. What do you think must be the case with the values for x in relation to the values for y to make a positive correlation? Student: Well, in this case as X gets larger so does Y. I think that if the larger one variable gets, the larger the other variable becomes, there is a positive correlation. Mentor: That is correct! A horizontal line has r=0. This means that there is no relationship between the two variables and the Y values are just randomly scattered on the grid. Can you guess what a line would look like with r=-1? Try experimenting with the scatter plot. Student: If r=-1 then the line will have a negative correlation and I think it will be pointing steeply downwards. Mentor: That is right, and if you add the outlier (9,3) to the data plot {(1,5) (2,4) (3,3) and (4,2)} (which has a r-value of -1) what do you think will happen to the line of best fit? What do you think the r-value will be? You can use the Regression activity to help you visualize this. Student: I think that the line will adjust to go up towards the outlier and so it will not be as steep downwards. This means that the correlation will not be as strongly negative and so it will be moving away from -1 and towards +1. However, it is still sloped downwards so it is not 0 yet. I would guess that r=-.4?

Mentor: Well, we can select Line of best fit and see. Student: Hey! I was not too far off. Mentor: That is true. In this case r=-.54 but you are on the right track. Just remember that the line of best fit must represent the outlier along with the rest of the data so the line of best fit is not always easy to predict. You can use this program to explore the correlation of different data sets and determine r-values. Student: Great! Now I understand more about lines of best fit and I can predict the r-values of scatter plots. |
