Class Intervals: Scale and Impression
|
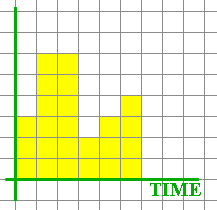
Student: In the Histogram Activity, I saw that the same data set can look different if I change scales. Mentor: Isn't it amazing? Student 1: Not really. I can easily make up an example and explain it. Student 2: I would like to see it. Student 1: Here, if we have yearly crime reports for six years with 3, 6, 6, 2, 3 and 4 crimes a year, with class interval sizes of one year the bar graph looks this way:

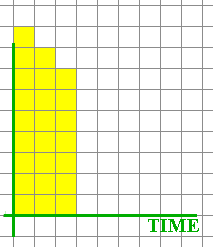
Student 1: So we can see that the crime rate was going up for the last three years. However, if we choose class intervals of two years, the impression from the bar graph is that the crime rate was going down all the time:

Student 2: I see how it happens: smaller class interval sizes show more exact picture. Mentor: In bar graphs, we usually talk about items rather than class intervals. In your example, "items" were years in the first picture and two-year periods in the second picture. In histograms, sometimes you can change class interval sizes just a little and change the impression a lot. Can you make an example of that? Student 1: If there are several values close to the boundary of one interval, you can move the boundary a little and the values will "jump" into the next class. For example, I want to build a histogram (not a bar graph) of daily temperatures. If the temperature values are 2, 3, 2, 2.5, 3, 2.5, 2.5 and the class intervals (starting from 0) are of the length 2.6, then the first class interval has 5 values and the second class interval has 2 values. However, if we change the interval length to 2.4, the first interval has 2 values and the second one 5 values! Student 2: What happens if we set the interval length to exactly 2.5? Mentor: It depends on the so-called end point convention. You can decide to count values that are on the exact boundary between two intervals either in the left or in the right interval. Whatever you decide, you better announce your decision to people who are going to read your histogram! Student: I think you should also stick to your end point convention for all intervals in one histogram. |
