Box Plot
|
Mentor: Now I would like to help you with another graphing method that allows you to compare different categories of data. It is called a box plot. It looks something like this:
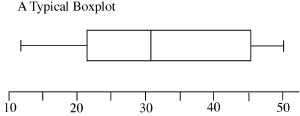
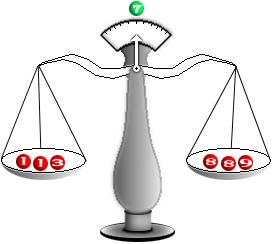
Each one of the vertical lines represents an important number related to the data set: The first and last line (leftmost and rightmost) are drawn at the lowest and highest data values. The three lines that form the box are drawn 25%, 50%, and 75% of the way through the data. These five numbers, the least, the 25%, the 50%, the 75%, and the greatest, together are called a 5 number summary. Student: Summary of what, the data? Mentor: Right. In the past we have talked about the mean of the data being the average of all of the data points. There is another important 'middle' number. It is called the median (M). Student: I know that. The median is the mid-point of the data set. If you were to line up the data set from least to greatest, split the number of data points in half, put the lower half of the data points on one side of the scale and the upper half of the data points on the other side of the scale, the median would be data value at the balancing point if there is an odd number of data points like this for data points 1 1 3 7 8 8 9:
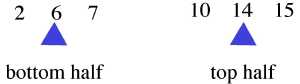
Mentor: That's right, the quantity of numbers on either side of the scale is the same. But keep in mind, if you have an even quantity of numbers, you average the two middle numbers and report their average as the median. You do not add this number to the list. It is simply the median value, and it marks the fiftieth percentile of the data. Also remember not to get median confused with the mean. The median has to do with the number of data points where the mean deals with the value of the data points. Now let's look at splitting the halves in half in order to find the ends of the box in the box plot. Student: You mean splitting the data into quarters? Mentor: Yes. We want to talk about the twenty-fifth and the seventy-fifth percentiles of the data. The twenty-fifth percentile is called the first quartile (Q1)or the lower quartile and the seventy-fifth percentile is the third quartile (Q3) or upper quartile. Student: What exactly is a quartile? Mentor: The lower quartile is the median of the first 50% of the data. And the upper quartile is the median of the last 50% of the data. Student: So is it just another point in the data set? Mentor: Much like the median, as long as there is an odd number of data points in the first or last 50% of the data. If there is an even number of data points then the quartile is the average of the two middle numbers, just like when we found the median. There are two possible ways of finding the quartiles. Neither of these methods is considered standard over the other way of finding the upper and lower quartiles so your final answer will depend on which method you choose to use. Student: What are the different methods? Mentor: Well, it depends on whether or not the median is part of the data set. If the median is not part of the original data set then you just use the numbers on one side of the median depending on which quartile you are trying to calculate. However, it gets a little tricky when you are trying to calculate the upper and lower quartiles of a data set in which the median is a number in the set. Student: What do you mean, "it gets tricky?" Mentor: I mean there are two different ways people calculate the quartile when the median is a number in the data set. One method people use, is to include the median in the calculation of both the upper and lower quartiles. The second way people calculate the upper and lower quartiles is to exclude the median from the calculation of both quartiles. Do you remember how we found the median to begin with? Student: Yes, we took the middle number of the data set if the set had an odd number of values, and we averaged the two middle digits if there was an even quantity of numbers in the data set. Mentor: Correct, and we use a similar method to find the different quartiles. If we choose to use the median in our calculations on sets where the median is a number in the data set, then to find the lower quartile we need to look at all of the digits from the lowest value through the median and calculate the median of those numbers. The median of the lower half of the data set is the first quartile. Can you figure out how we will calculate the third quartile? Student: My guess is, you look at all the numbers from the median to the greatest number, calculate their median and that number will be equal to the third quartile. Mentor: You are absolutely correct. Do you have any questions? Student: You covered how to calculate the quartiles when the median is part of the data set but, what if the median is not a part of the data set? Mentor: Good question! If the median is not part of the data set and you want to calculate the upper quartile then you just calculate the median of the numbers in the upper 50% of the data set. Student: And for the lower quartile you just find the median of the lower 50% of the data set. Mentor: Exactly, now do you want to give me a couple of data sets in which to calculate the median? Student: Let's use 2 6 7 10 14 15 since it has an even number of numbers in the set, and then we can use 1 4 9 12 16 23 24 for an odd sized data set. The median for the first set is 8.5 - I averaged 7 and 10. The median for the second set is 12, the middle number. Mentor: Good. Now for the quartiles. For 2 6 7 10 14 15 the first quartile is equal to 6 and the third quartile equal to 14:
Student: Right, I got that. Let me try the other set: 1 4 9 12 16 23 24. If I include the median to calculate the quartiles then the first quartile is the average of 4 and 9 or 6.5 and the third quartile is the average of 16 and 23 or 19.5. If I do not include the median to calculate the quartiles then the lower quartile is 4 and the upper quartile is 23.
Mentor: Right! That was great. So far we have calculated the median, first quartile, and the third quartile for the second data set. What else do we need to complete our five number summary? Student: The highest and lowest values of the data set. Mentor: Right again. We then use those five numbers in drawing our box plot. Student: Okay.
Mentor: The last couple of numbers that are of interest are the ranges. The range of the data set is the greatest value minus the smallest value. The interquartile range is when you subtract the first quartile from the third quartile. Do you know what the interquartile range represents? Student: The middle fifty percent of the data. Mentor: Right. And the middle fifty percent of the data determines the length of the box. So for the data set 1 4 9 12 16 23 24 here is our box plot:
|
