|

Graphit Help
How Do I Use This Activity?
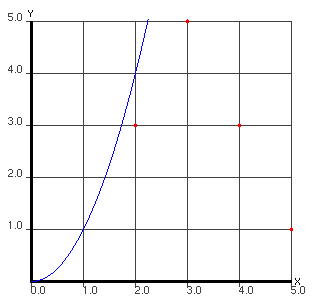
This activity allows the user to plot ordered pairs and algebraic functions on the same coordinate plane.
This Java applet requires a Java-capable browser. If you don't see the applet Java may not be
functional in your browser or on your machine.
Controls and Output
- The area at the top of the screen is where the plot is displayed.

- The Function and Data areas are for entering functions (in terms of x) and ordered pairs, respectively. For more information on entering functions, see Graph Sketcher Help. For more information about entering data, see Simple Plot Help.
You can plot a total of ten functions and/or data sets at once (e.g. three functions, three data sets; five functions, one data set; no functions, six data sets). Separate each function with a comma. Separate data sets by typing newgraph on a line by itself in the Data window. If you want to specify your own colors for the graphs you can replace newgraph with the following keywords: bluegraph, redgraph, greengraph, cyangraph, graygraph, magentagraph, yellograph, orange, purplegraph, crimsongraph.
- You can choose from two plot types. "Connected" draws a line from one point to the next (before the line is drawn the points are sorted by their x coordinates.) "Scatter Plot" just draws the points as dots on the graph. These options do not affect the way functions are
graphed, only ordered pairs.

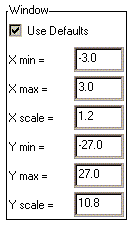
- The Window settings determine how the coordinate plane will appear on your screen. X min and X max are the minimum and maximum x-values displayed on the graph. Similarly for Y min and Y max. X scale is the distance between vertical gridlines if Hide Grid is
checked. Y scale is the distance between horizontal gridlines if Hide Grid is unchecked.
If the Use Defaults box is unchecked, Graphit will choose appropriate values for you. If you uncheck that box, you can override Graphit's values with your own. Any changes you make to the window parameters will take effect the next time you click the Plot button.

- You can choose what you see on the graph. You can elect to hide all functions, all data, and/or the grid lines by checking the appropriate box in the Hide menu.

- The applet also can tell you the location of any click. Just click the mouse anywhere on the graph that you want to know the coordinates of and the coordinates will appear in the Mouse Pos. box.


Please direct questions and comments about this project to
Interactivate@shodor.org
© Copyright 1997-2002
The Shodor Education Foundation, Inc.
|


