Data Flyer Help

How Do I Use This Activity?

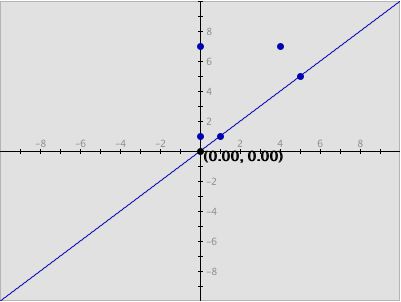
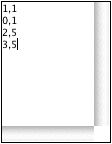
This activity allows the user to plot data pairs and algebraic functions on the same coordinate plane.

This Java applet requires a Java-capable browser. If you don't see the applet Java may not be functional in your browser or on your machine.
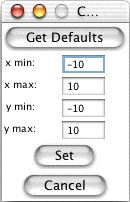
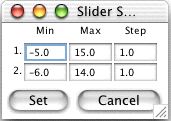
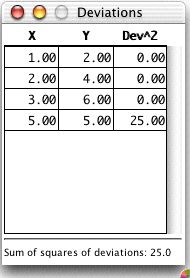
Controls and Output

  • The area in the center of the screen is where the plot is displayed.

  • Checking the Show Grid check box will make the graph also display a grid.

  • You may set the graph boundries by clicking the Set Window... button, entering new values for the x max, x min, y max, or y min and clicking the Set button. To return the values to their defaults you click the Get Defaults button, and click the Set button again. If you do not want to change the window you may click cancel.

  • Checking the Show Trace check box will make it so the previous graphs of the functions are not cleared.

  • The Y= and Data areas are for entering functions (in terms of x) and ordered pairs, respectively. You enter the ordered pairs by seperating the x and y of the ordered pair with commas, and putting each ordered pair on a seperate line.

  • After entering the data, you may plot it by pressing the Plot Data button.

  • You may clear the data by clicking the Clear Data button.

  • Data Flyer also allows you to enter an algebraic function in the box labeled y =. For information on the syntax of entering functions, see Graph Sketcher Help.

  • Enter the function you want to graph in the box marked y =. Any constant or coefficient you wish to be able to manipulate must be entered as a number. For instance, if you wish to experiment with the linear function y = x + 8 and wish to manipulate the coefficient of x it is necessary to type the equation as y = 1*x + 8 so the computer recognizes the multiplier as a parameter. Likewise if you wanted to experiment with the sin function y = sin(x) and be able to manipulate the parameters such as the y-intercept, phase, frequency, and amplitude, it is necessary to type y = 1*sin(1*x+0)+0. (Try typing in both and clicking the set function button so you can see the difference.)

  • Checking the Exponents Change box will make it so that when you click the Set Function button a slider for the exponent will pop up.

  • Once you have set the function you may enter a different function by clicking the Change Function button, entering the new function and clicking the Set Function button again.

  • You may set the sliders back to the original values that they had when the the function was entered by clicking the Reset Sliders button.

  • The Slider Limits... button brings up a dialog box that allows you to set the minimum and maximum values of each slider bar. You can also set the step size for each slider bar. The step size increments the value of the constant in the function. For instance, if you set the minimum to 0, the maximum to 1, and the step to 0.1, the slider will increment the value of the constant at the intervals of 0, 0.1, 0.2, etc. However, if you set the step to 0.2, the slider will stop at 0, 0.2, 0.4, etc.

  • At the top of the applet it gives you the sum of the square of the deviations, the closer this number is to zero the more accurate your function in relation to your data. You may see a data table of these deviations by clicking the Show Deviations button.


Please direct questions and comments about this project to Interactivate@shodor.org
© Copyright 1997-2002 The Shodor Education Foundation, Inc.