|

Function Flyer Help
Note: This is the How page for the updated version of Function Flyer.
The How page for the old version is located
here.
How Do I Use This Activity?
This activity allows the user to manipulate a function graphically by using slider bars to change
the value of the constants and coefficients in the function.
This Java applet requires a Java-capable browser. If you don't see the applet Java may not be
functional in your browser or on your machine.
Controls and Output
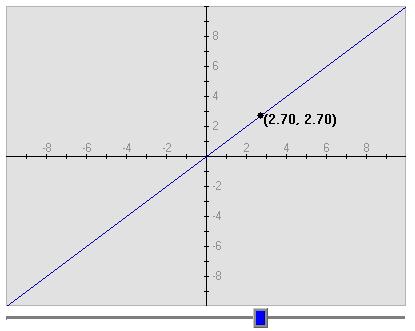
- The initial graph at the top of the activity is set to y = x.
The coordinates of the black point on the function are printed
beside the point. You can move the point left and right on the
graph by using the blue slider bar below the graph.
- Enter the function you want to graph in the box marked
y =.
Any constant or coefficient you wish to be able to manipulate must
be entered as a number. For instance, if you wish to experiment with the linear function
y = x + 8 and wish to manipulate the coefficient of x it is necessary to type the equation
as y = 1*x + 8
so the computer recognizes the multiplier as a parameter. Likewise if you wanted to experiment
with the linear function y = 2*x and be able to manipulate the y-intercept it is necessary
to type y = 2*x + 0. (Try typing in both and clicking the set function button so you can see
the difference.)

- Use the following notations for the operations:
| Function |
Symbol |
Examples (including combinations of functions) |
| addition |
+ |
x + 3 x plus three |
| subtraction |
- |
5 - x five minus x |
| multiplication |
* |
(x - 2)*x x times x minus two |
| division |
/ |
3/x three divided by x |
| power |
^ |
x^3 - 1 x to the power of three minus one |
| power |
** |
x**3 - 1 x to the power of three minus one |
| π (pi) |
pi |
sin(pi*x) sin of π (pi) times x |
| square root |
sqrt(...) |
sqrt(x-1) square root of x minus one |
nth root
(see * below) |
x^(1/n) |
x^(1/3) cube root of x |
| absolute value |
abs(...) |
abs(3 - x) absolute value of three minus x |
| e to the power of x |
exp(...) |
exp(x) e to the power of x |
| sine |
sin(...) |
sin(x**2) sine of x squared |
| cosine |
cos(...) |
cos(5 - x) cosine of five minus x |
| tangent |
tan(...) |
tan(x) tangent x |
| arcsine |
asin(...) |
2*asin(x) two times arcsine x |
| arccosine |
acos(...) |
acos(x) arccosine x |
| arctangent |
atan(...) |
atan(x) arctangent of x |
| hyperbolic sine |
sinh(...) |
sinh(1 - x) hyperbolic sine of one minus x |
| hyperbolic cosine |
cosh(...) |
cosh(10/x) hyperbolic cosine of ten divided by x |
| hyperbolic tangent |
tanh(...) |
tanh(x) hyperbolic tangent of x |
| natural logarithm |
log(...) |
log(x) natural logarithm of x |
| base 10 logarithm |
log10(...) |
log10(x + 5) base ten logarithm of x plus five |
* When x is less than zero, the exponent must be
written as a whole number or in fraction form, not a decimal.
For instance, if you want to graph the fifth root of negative
numbers, you must write x^(1/5), not x^(0.2).
- Beside the function is a checkbox labeled Exponents Change. If your function has an
exponent which you want to remain constant and do not want to be able to manipulate the
value of the exponent, leave the box unchecked.
- After entering the function, click on the Set Function button to the right of the
input box. The computer graphs the function. The equation of the
function appears below the graph where each constant is written in a different color.
Slider bars will appear colored the same colors as the respective constants or coefficients
which they manipulate.
- The Change Function button takes the user back to the first screen to make a change to
the function or type in a new function altogether.
- The Reset Sliders button will place the sliders back in
their original, central position after being used.
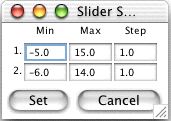
- To change the minimum and maximum of the slider bars, click the
Slider Limits... button. This will display a window where you
may set the minimum and maximum of each slider bar. You can also set
the step size for each slider bar. The step size determines what
values the slider bar will stop at. For instance, if you set the
minimum to 0, the maximum to 1, and the step to 0.1, the slider will
stop at 0, 0.1, 0.2, etc. However, if you set the step to 0.2, the
slider will stop at 0, 0.2, 0.4, etc.
- To see a grid on the graph, check the Show Grid
checkbox.
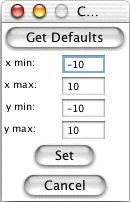
- You may set the graph boundries by clicking the
Set Window... button. This will display a new window where
you may enter new values for the x max, x min,
y max, and y min. After you have entered your new settings, clicke
the Set button. To return the graph boundaries
to their defaults click the Get Defaults button followed
by the Set button.
- Checking the Show Trace checkbox will leave old functions
on the graph as you change the slider bars. For instance, suppose
your function is y = 3*x+5. If you check Show Trace and then
drag the slider bar for the slope through the values 3, 4, 5, and 6,
all four functions (y = 3*x+5, y = 4*x+5, y = 5*x+5, and y = 6*x+5)
will be visible at the same time.
The Clear Trace button will remove the old graphs.
Please direct questions and comments about this project to
Interactivate@shodor.org
© Copyright 1997-2002
The Shodor Education Foundation, Inc.
|