|

Bar Graph Help Page
How Do I Use This Activity?
This activity allows the user to graph data sets in bar graphs. The color, thickness and scale of the graph are adjustable. Users may input their own data, or use or alter pre-made data sets.
This Java applet requires a Java-capable browser. If you don't see the applet Java may not be
functional in your browser or on your machine.
Controls and Outputs
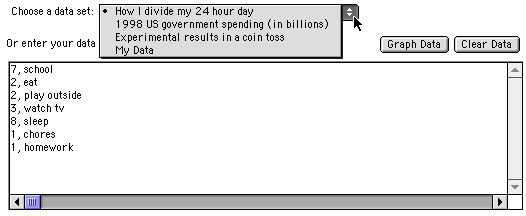
- Pre-made data sets may be selected from a choice menu. To alter the data, the user may change the data displayed in the data box below the choice menu, and hit the "Graph Data" button. To clear all data, the user may hit the "Clear Data" button. The choice menu, data box with data, and the two buttons are shown below.

- The user may manually adjust the Y scale of the bar graph by dragging the vertical scrollbar next to the graph. The thickness of the bars may be altered by dragging the scrollbar on the X axis.
- To change the scale of the graph to a specific value, the user may enter Maximum and Minimum Y scale values in the Number Inputs, and click the "Set Min and Max" button, all shown below.

- To change the color of the bars, the user may select from the Bar Color drop down choice menu.

Please direct questions and comments about this project to
Interactivate@shodor.org
© Copyright 1997-2002
The Shodor Education Foundation, Inc.
|


