A RealSim Surface Look at Descriptive Statistics
Overview
This lesson uses a visually oriented activity to help students grasp the intuitive concept of mean and variance. The activity is set in a materials science background, and relates observable properties of materials to their basic atomic or molecular structure.
Objectives
Students will:- learn about mean, variance, and standard deviation as quantitative tools for describing the qualities of a set of data.
Standards
This lesson fulfills parts of the following standards and curriculum guidelines:
- NCTM standard on statistics for both grades 5-8 and 9-12
- NSES content standard (9-12 A) on science as inquiry
- DoDEA Science 7 objective on observing and recording data
Description
- Experimentation/Observation
Let the students experiment with annealing a particular number of charges using various annealing schedules. The schedules can be changed by selecting Cooling Schedule under the Simulation menu. Once the Cooling Schedule window is open, students can edit the Annealing Parameters although they should leave the Auto Cool box checked. Ask them what is different about the results when different schedules are used. The students should notice that different annealing schedules will result in lattices of varying perfection. Explain that lack of regularity in a crystal lattice can result in a less transparent crystal, or less-hardened steel. Regularity in a lattice can be an important factor in materials science applications.
- Discussion
Discuss the fact that an important qualities such as regularity are often quantified both for research as well as development/application purposes. Examples students might be familiar with are SPF ratings on sunblocks, octane numbers for gasoline, etc. If we looked at two different annealings of 16 charges, we might be able to say "this one is more regular than that one" simply by "eyeballing" it, but a such a subjective assessment is of limited use. What if two people disagree on which one looks more regular, for example, or how would we decide how much more regular one configuration is than another? Ask the students if they can think of some way to quantify "regularity". Suggest that considering distances between adjacent charges might be a good place to start, since in a perfectly square lattice, for example, all such distances would be identical.
- Guided Investigation
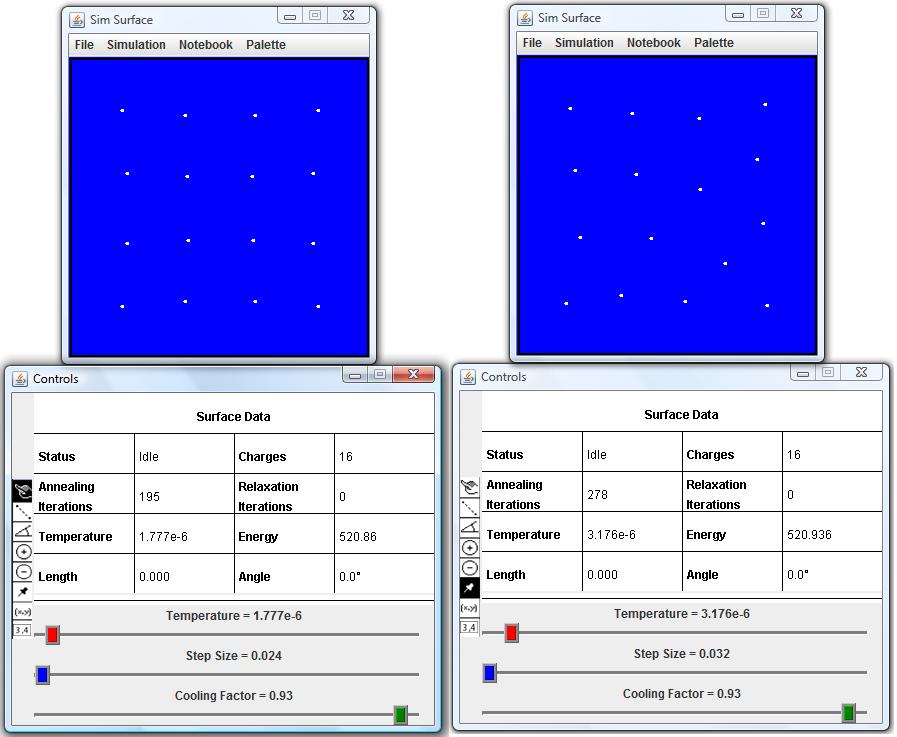
Have the students use Surface's measuring tool to measure all of the nearest neighbor distances in annealed patterns resulting from different annealing schedules. For each pattern, find the mean of the distances, and explain that by checking the variance (or standard deviation), they can determine how much "spread" there is in the data. This might be used as a measurement of regularity--zero variance would be a perfectly square lattice, while a high variance would suggest more irregularity.
An example of the results of running two different annealing schedules on 16 electrons with a charge of 10 on each wall: