 Shodor Home Page

How does the actual calculation work?
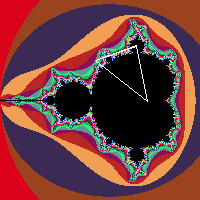
A visual representation of the Mandelbrot Set is similar to the graph of a function. The horizontal axis represents Real numbers, and the vertical axis represents Imaginary numbers. The origin (zero on both axes) is very close to the lower point of the triangle in the above picture.
In the Mandelbrot Set z**2+c, each point is squared and added to itself N times (indicated by "depth"). If this new number that we get after N iterations leaves the circle of radius 2 centered about the origin, we say that the point we started with is outside the Mandlebrot Set and we color it in. Otherwise, we leave the point black. The different-colored bands surrounding the Mandelbrot Set signify that the points within each band left the circle of radius 2 after the same number of calculations.
Go to Fractal Microscope Curriculum Resources